1. How your client ( AAL only ) compares to the industry averages you calculated using the four companies.
2. Based on your analytical procedures, identify two specific accounts you believe are most likely to be materially misstated and explain your reasoning.
3. Design an audit plan for one of the accounts you identified in question 3 above. Your audit plan must include specific audit procedures to test the following assertions, and label which test corresponds to which assertion. You cannot pick accounts receivable as your account. Existence/occurrence
Completeness
Cutoff
Accuracy or valuation,
whichever is appropriate for the account you identified.
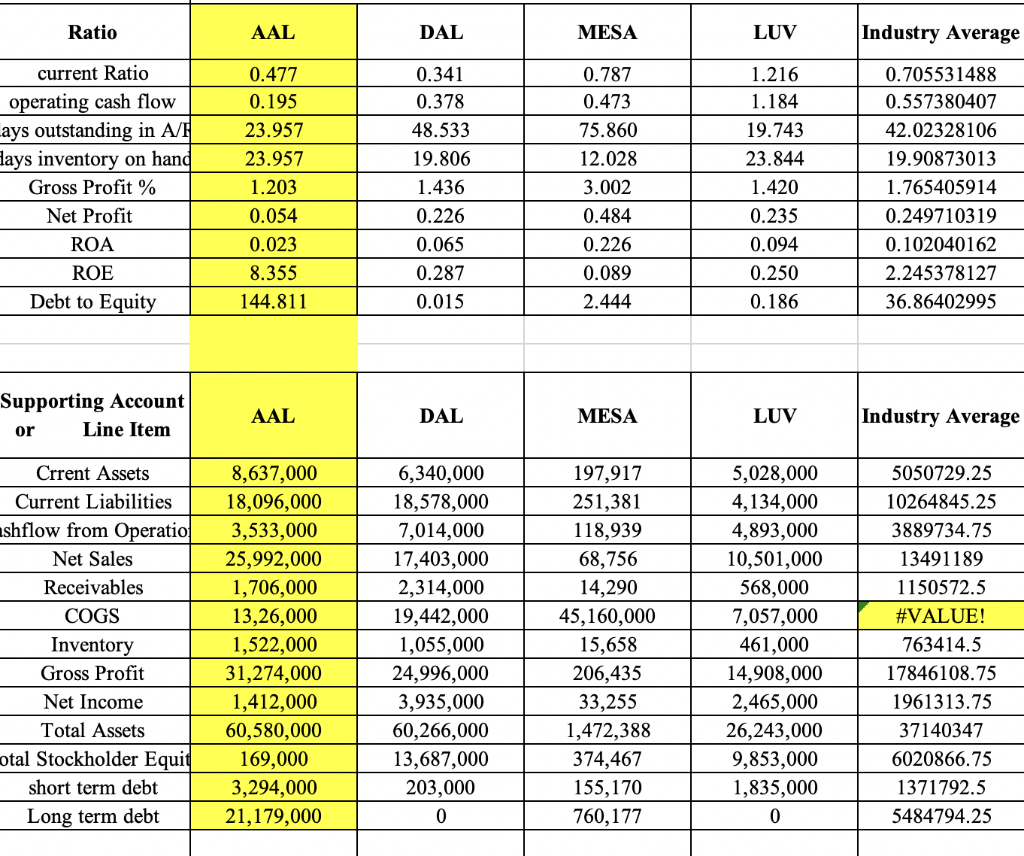
DAL MESA Ratio current Ratio operating cash flow ays outstanding in A/ lays inventory on han Gross Profit % AAL LUV Industry Average 0.705531488 0.557380407 42.02328106 19.90873013 1.765405914 0.249710319 0.102040162 2.245378127 36.86402995 0.781 0.477 0.195 23.957 23.957 0.378 48.533 19.806 1.436 0.226 0.065 0.287 75.860 12.028 3.002 1.420 0.235 0.094 0.250 0.054 0.023 ROA ROE Debt to Equity 0.226 0.089 Supporting Account AAL DAL MESA LUV Industry Average Line Item 8,637,000 18,096,000 6,340,000 18,578,000 7,014,000 17,403,000 2,314,000 19,442,000 1,055,000 24,996,000 3,935,000 60,266,000 13,687,000 203,000 0 197,917 251,381 118,939 68,756 14,290 45,160,000 15,658 206,435 33,255 1,472,388 374,467 5,028,000 4,134,000 4,893,000 10,501,000 568,000 7,057,000 461,000 14,908,000 2,465,000 26,243,000 9,853,000 1,835,000 0 Crrent Assets Current Liabilities 5050729.25 10264845.25 3889734.75 13491189 1150572.5 #VALUE! 763414.5 17846108.75 1961313.75 37140347 6020866.75 1371792.5 5484794.25 shflow from Operatio3,533,000 Receivables COGS Inventory Gross Profit Net Income Total Assets otal Stockholder Equi short term debt Long term debt 25,992,000 1,706,000 13,26,000 1,522,000 31,274,000 1,412,000 60,580,000 169,000 3,294,000 21,179,000 760,177 DAL MESA Ratio current Ratio operating cash flow ays outstanding in A/ lays inventory on han Gross Profit % AAL LUV Industry Average 0.705531488 0.557380407 42.02328106 19.90873013 1.765405914 0.249710319 0.102040162 2.245378127 36.86402995 0.781 0.477 0.195 23.957 23.957 0.378 48.533 19.806 1.436 0.226 0.065 0.287 75.860 12.028 3.002 1.420 0.235 0.094 0.250 0.054 0.023 ROA ROE Debt to Equity 0.226 0.089 Supporting Account AAL DAL MESA LUV Industry Average Line Item 8,637,000 18,096,000 6,340,000 18,578,000 7,014,000 17,403,000 2,314,000 19,442,000 1,055,000 24,996,000 3,935,000 60,266,000 13,687,000 203,000 0 197,917 251,381 118,939 68,756 14,290 45,160,000 15,658 206,435 33,255 1,472,388 374,467 5,028,000 4,134,000 4,893,000 10,501,000 568,000 7,057,000 461,000 14,908,000 2,465,000 26,243,000 9,853,000 1,835,000 0 Crrent Assets Current Liabilities 5050729.25 10264845.25 3889734.75 13491189 1150572.5 #VALUE! 763414.5 17846108.75 1961313.75 37140347 6020866.75 1371792.5 5484794.25 shflow from Operatio3,533,000 Receivables COGS Inventory Gross Profit Net Income Total Assets otal Stockholder Equi short term debt Long term debt 25,992,000 1,706,000 13,26,000 1,522,000 31,274,000 1,412,000 60,580,000 169,000 3,294,000 21,179,000 760,177