Answered step by step
Verified Expert Solution
Link Copied!

Question

1 Approved Answer

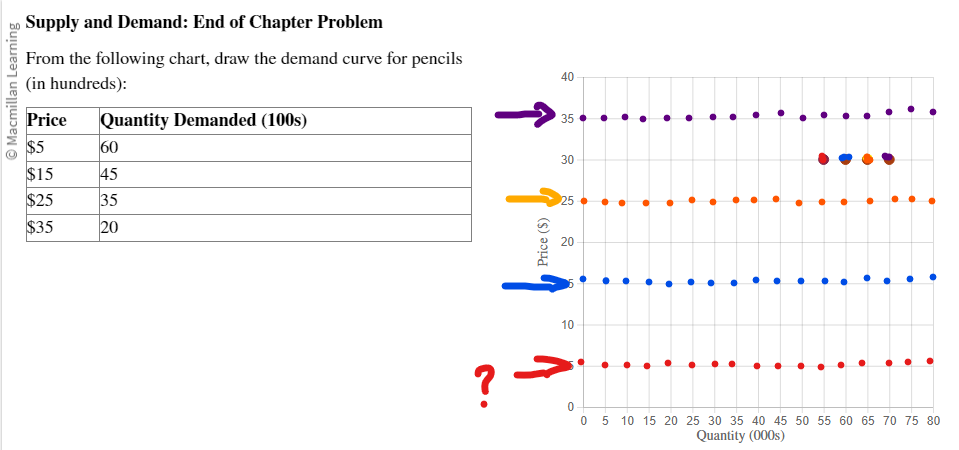
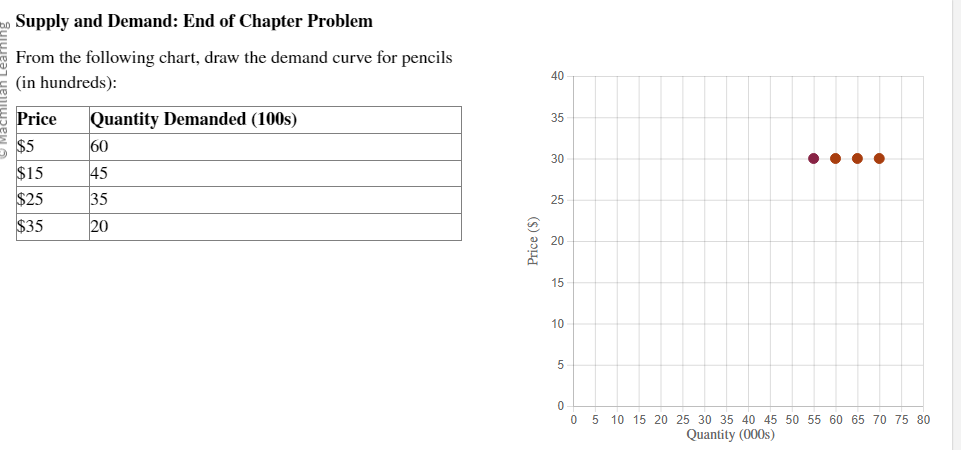
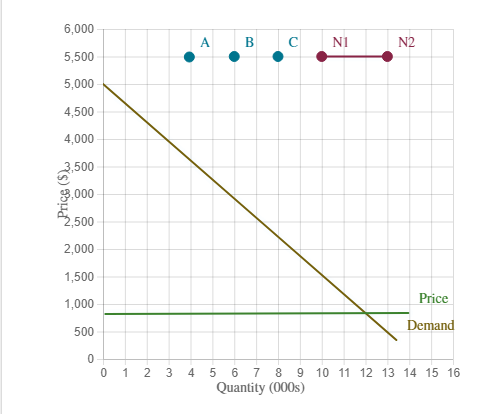
1. I have color coded the dot which can place in one of the dot with the same color. Supply and Demand: End of Chapter

1. I have color coded the dot which can place in one of the dot with the same color.

image text in transcribedimage text in transcribedimage text in transcribedimage text in transcribedimage text in transcribed
Supply and Demand: End of Chapter Problem From the following chart, draw the demand curve for pencils (in hundreds): 40 @ Macmillan Learning Price Quantity Demanded (100s) 35 $5 60 30 $15 45 $25 35 25 $35 20 Price ($) 20 10 0 5 10 15 20 25 30 35 40 45 50 55 60 65 70 75 80 Quantity (000s)Supply and Demand: End of Chapter Problem From the following chart, draw the demand curve for pencils (in hundreds): 40 Price Quantity Demanded (100s) 35 $5 60 30 $15 45 $25 35 25 $35 20 Price ($) 20 15 10 5 0 0 5 10 15 20 25 30 35 40 45 50 55 60 65 70 75 80 Quantity (000s)m Supply and Demand: End of Chapter Problem In Sucrosia, the supply curve for sugar is presented in both the graph and the table. E '1'acr'1illan Learnin Price (per lull-pound bag) $70 20.000 Price at sugar 0 5 10 15 20 25 Quantity of suger {Wills} Under pressure from nutrition activists, the government decides to tax sugar producers with a $5 tax per 100 pound bag. Using the graph, draw the new supply curve. After the tax is enacted, what price will bring forth quantities of 10,000? 15,000? 20,000? Price {per 100 pound bag) Quantity B 15,000 C 20,000 to Supply and Demand: End of Chapter Problem Learning Let's think about the demand for LED TVs. Macmillan a. If the price for a 60-inch LED TV is $800, and Newhart would be willing to pay $3,000, what is Newhart's consumer Newhart's consumer surplus: $ surplus? b. Consider the following figure for the total demand for LED TVs. At $800 per TV, 12,000 TVs were demanded. What Total consumer surplus: $ would be the total consumer surplus (CS)? Calculate the total, and identify it on the diagram with the points A, B, and C. c. Where is Newhart in the figure? Use the line segment N to show his position. 6,000 N1 N2 5,500 5,000 4,500 4,000 2,500 3,000 P2 500 2,000 1,500 1,000 Price 500 Demand 0 0 0 1 2 3 4 5 6 7 8 9 10 11 12 13 14 15 16

Step by Step Solution

There are 3 Steps involved in it

Step: 1

blur-text-image

Get Instant Access to Expert-Tailored Solutions

See step-by-step solutions with expert insights and AI powered tools for academic success

Step: 2

blur-text-image

Step: 3

blur-text-image

Ace Your Homework with AI

Get the answers you need in no time with our AI-driven, step-by-step assistance

Get Started

Recommended Textbook for

Plenitude The New Economics Of True Wealth

Authors: Juliet Schor

1st Edition

1594202540, 9781594202544

More Books

Students also viewed these Economics questions

Question

Discuss various types of training methods.

Answered: 1 week ago

Question

Illustrate the value of different types of employment tests.

Answered: 1 week ago

Question

Outline key considerations when making a hiring decision.

Answered: 1 week ago