

Question
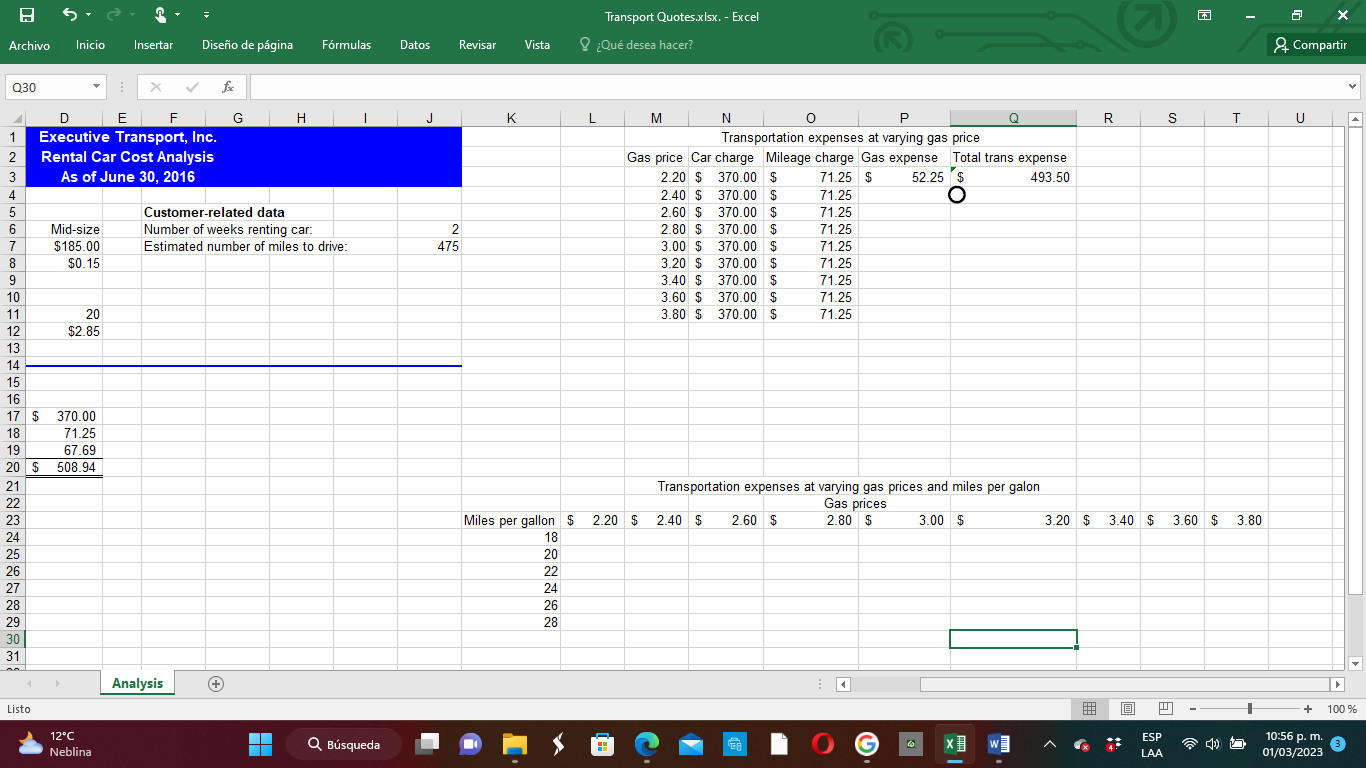
1. I have to set up the structure of a one-variable data table on the Analysis worksheet that shows the car charge, mileage charge, gas
1. I have to set up the structure of a one-variable data table on the Analysis worksheet that shows the car charge, mileage charge, gas expense, and total transportation expense given changes in the average price of gas from $2.20 to $3.80 by increments of $0.20.
Here I would like to know which was the formula to obtain P3?
6. A few rows below the one-variable data table, create the structure for a two-variable data table that shows the total projected transportation expense given the interaction between average gas prices from $2.20 to $3.80 by increments of $0.20 and miles per gallon from 18 to 28 by increments of 2 miles per gallon.
Here I would like to know which would be the formula to obtain L24?
Step by Step Solution
There are 3 Steps involved in it
Step: 1

Get Instant Access to Expert-Tailored Solutions
See step-by-step solutions with expert insights and AI powered tools for academic success
Step: 2

Step: 3
Ace Your Homework with AI
Get the answers you need in no time with our AI-driven, step-by-step assistance
Get Started
Database Processing
Authors: David M. Kroenke
12th Edition International Edition
1292023422, 978-1292023427