Question
1. Imagine a company lunchroom that sells pizza by the slice. Using the flowing data, plot the points and graph the demand and supply

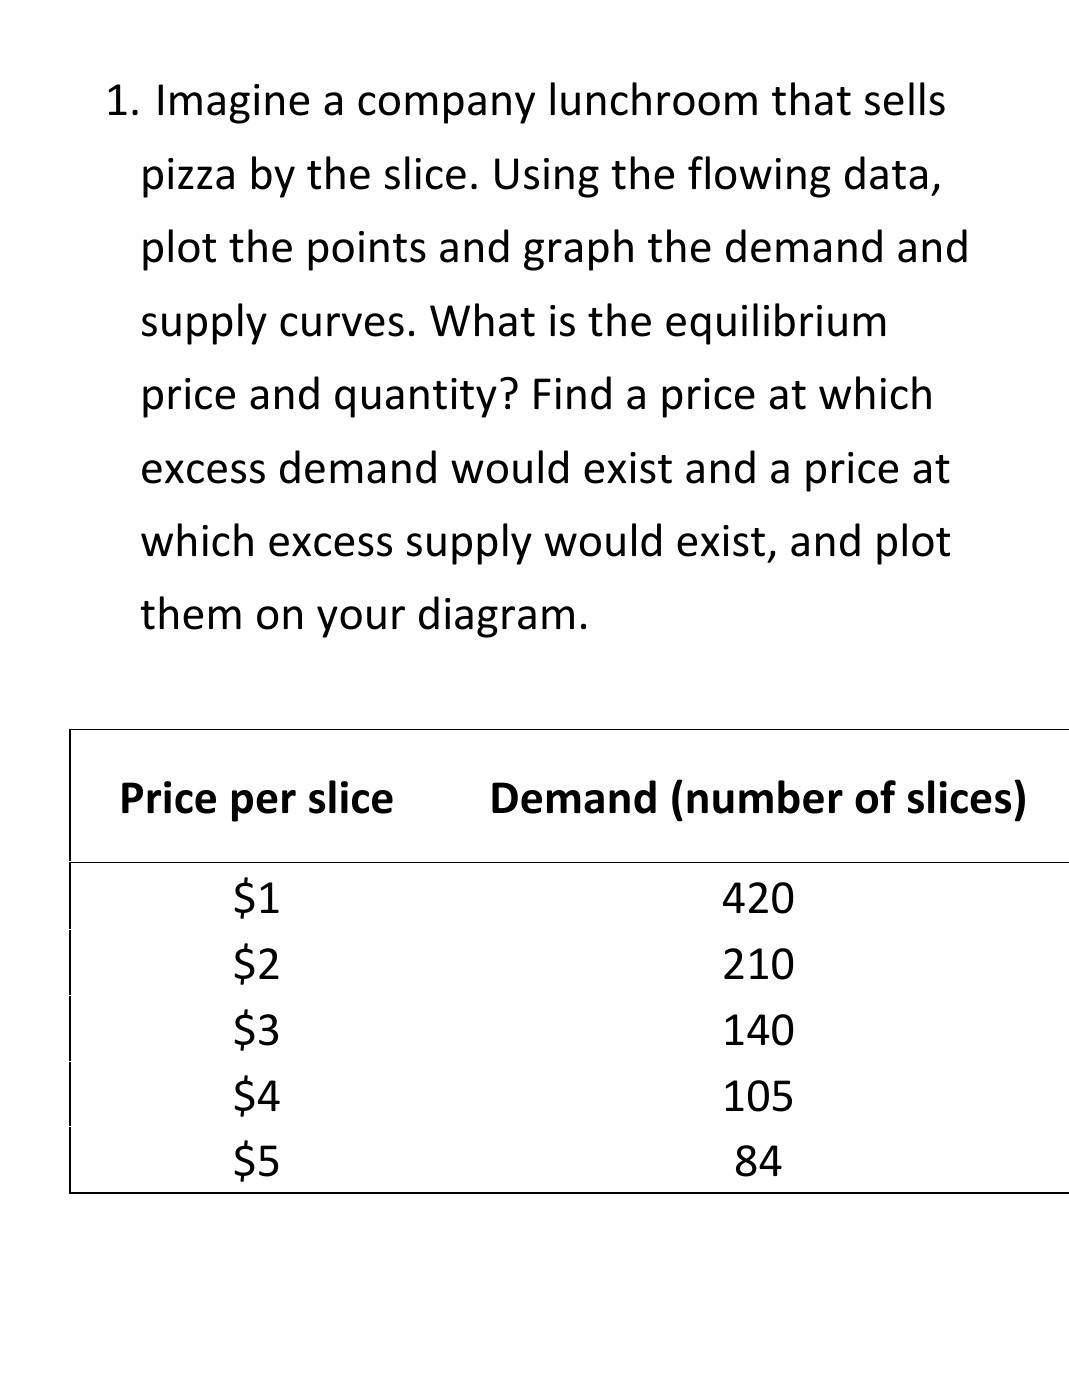
1. Imagine a company lunchroom that sells pizza by the slice. Using the flowing data, plot the points and graph the demand and supply curves. What is the equilibrium price and quantity? Find a price at which excess demand would exist and a price at which excess supply would exist, and plot them on your diagram. Price per slice Demand (number of slices) $1 420 $2 210 $3 140 $4 105 $5 84
Step by Step Solution
There are 3 Steps involved in it
Step: 1

Get Instant Access to Expert-Tailored Solutions
See step-by-step solutions with expert insights and AI powered tools for academic success
Step: 2

Step: 3

Ace Your Homework with AI
Get the answers you need in no time with our AI-driven, step-by-step assistance
Get StartedRecommended Textbook for
Principles Of Microeconomics
Authors: Robert Frank, Ben Bernanke, Kate Antonovics, Ori Heffetz
6th Edition
0073517852, 978-0073517858
Students also viewed these Economics questions
Question
Answered: 1 week ago
Question
Answered: 1 week ago
Question
Answered: 1 week ago
Question
Answered: 1 week ago
Question
Answered: 1 week ago
Question
Answered: 1 week ago
Question
Answered: 1 week ago
Question
Answered: 1 week ago
Question
Answered: 1 week ago
Question
Answered: 1 week ago
Question
Answered: 1 week ago
Question
Answered: 1 week ago
Question
Answered: 1 week ago
Question
Answered: 1 week ago
Question
Answered: 1 week ago
Question
Answered: 1 week ago
Question
Answered: 1 week ago
Question
Answered: 1 week ago
Question
Answered: 1 week ago
Question
Answered: 1 week ago
View Answer in SolutionInn App


