1. Import HBAT200 data into RStudio
2. Build an appropriate regression model that will explain "customer satisfaction" (Please note that X19-X23 are outcome variable, so do NOT use them as your independent variables)
3. Check model assumptions
4. Interpret the model and identify the factors that influence customer satisfaction
5. Provide recommendations to management on how to increase customer satisfaction
6. Perform segmentation (based on variables X1-X5) to identify the most satisfied group of customers
7. Test a non-linear effect of product quality on customer satisfaction 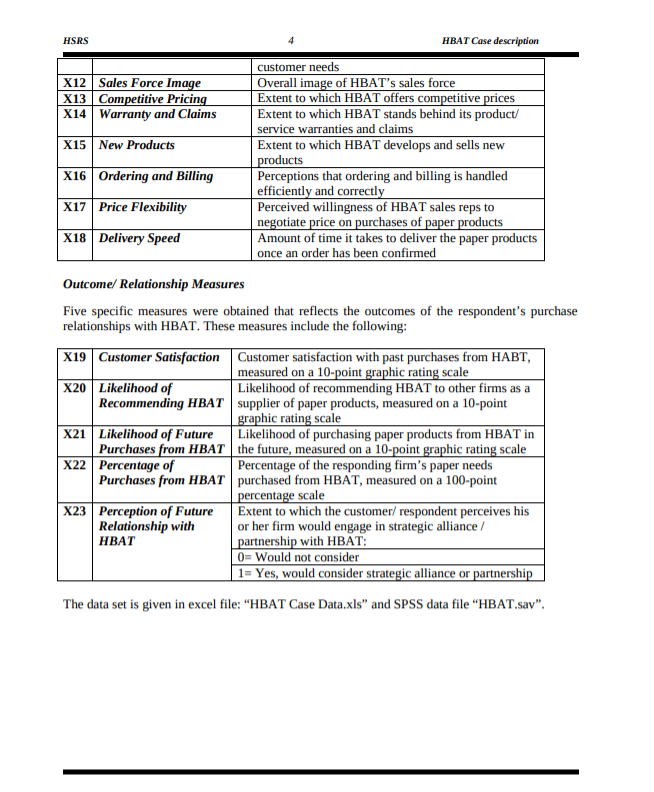
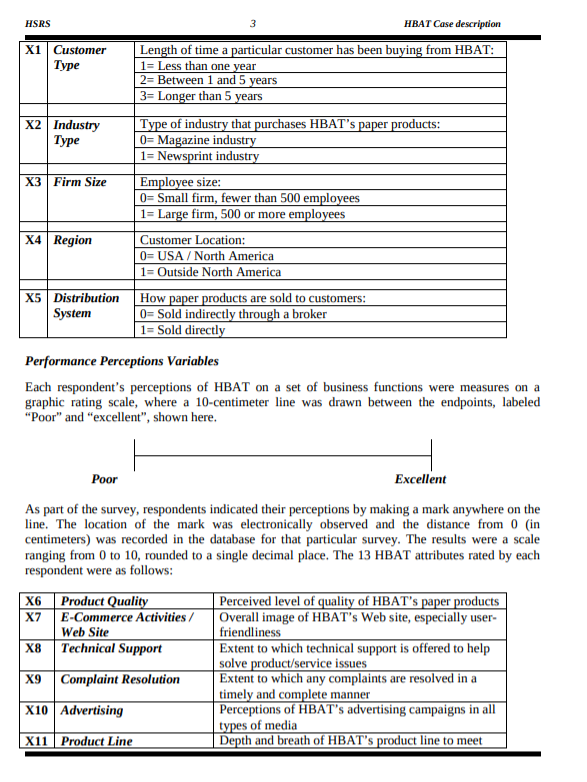
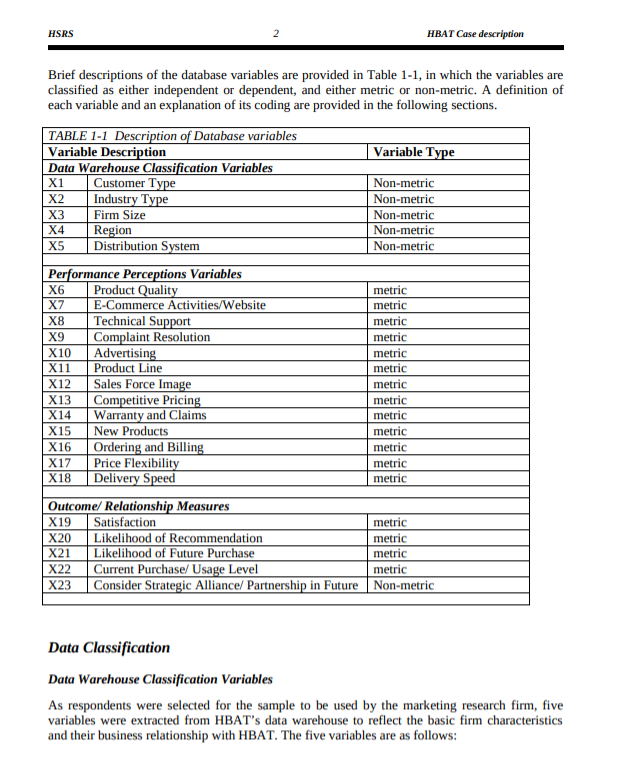
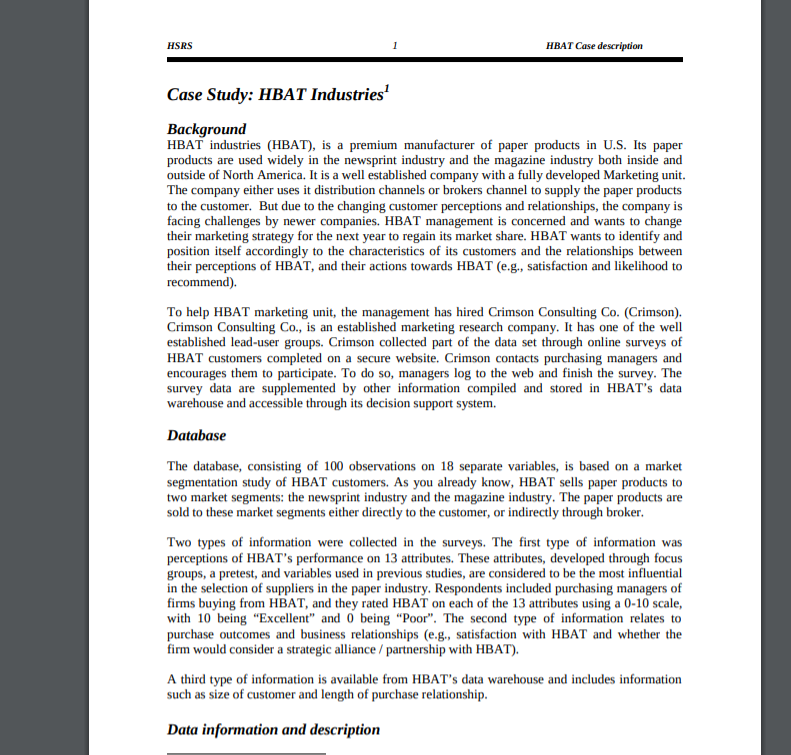
HSRS HBAT Case description X12 Sales Force Image X13 Competitive Pricing X14 Warranty and Claims X15 New Products customer needs Overall image of HBAT's sales force Extent to which HBAT offers competitive prices Extent to which HBAT stands behind its product/ service warranties and claims Extent to which HBAT develops and sells new products Perceptions that ordering and billing is handled efficiently and correctly Perceived willingness of HBAT sales reps to negotiate price on purchases of paper products Amount of time it takes to deliver the paper products once an order has been confirmed X16 Ordering and Billing X17 Price Flexibility X18 Delivery Speed Outcome Relationship Measures Five specific measures were obtained that reflects the outcomes of the respondent's purchase relationships with HBAT. These measures include the following: X19 Customer Satisfaction Customer satisfaction with past purchases from HABT, measured on a 10-point graphic rating scale X20 Likelihood of Likelihood of recommending HBAT to other firms as a Recommending HBAT supplier of paper products, measured on a 10-point graphic rating scale X21 Likelihood of Future Likelihood of purchasing paper products from HBAT in Purchases from HBAT the future, measured on a 10-point graphic rating scale X22 Percentage of Percentage of the responding firm's paper needs Purchases from HBAT purchased from HBAT, measured on a 100-point percentage scale X23 Perception of Future Extent to which the customer/respondent perceives his Relationship with or her firm would engage in strategic alliance / HBAT partnership with HBAT: 0= Would not consider 1= Yes, would consider strategic alliance or partnership The data set is given in excel file: "HBAT Case Data.xls" and SPSS data file "HBAT.sav". HSRS 3 HBAT Case description X1 Customer Type X2 Industry Type X3 Firm Size Length of time a particular customer has been buying from HBAT: 1= Less than one year 2= Between 1 and 5 years 3= Longer than 5 years Type of industry that purchases HBAT's paper products: 0= Magazine industry 1= Newsprint industry Employee size: 0= Small firm, fewer than 500 employees 1= Large firm, 500 or more employees Customer Location: 0=USA/North America 1= Outside North America How paper products are sold to customers: 0= Sold indirectly through a broker 1= Sold directly X4 Region X5 Distribution System Performance Perceptions Variables Each respondent's perceptions of HBAT on a set of business functions were measures on a graphic rating scale, where a 10-centimeter line was drawn between the endpoints, labeled "Poor" and "excellent", shown here. Poor Excellent As part of the survey, respondents indicated their perceptions by making a mark anywhere on the line. The location of the mark was electronically observed and the distance from 0 (in centimeters) was recorded in the database for that particular survey. The results were a scale ranging from 0 to 10, rounded to a single decimal place. The 13 HBAT attributes rated by each respondent were as follows: X6 Product Quality Perceived level of quality of HBAT's paper products X7 E-Commerce Activities / Overall image of HBAT's Web site, especially user- Web Site friendliness X8 Technical Support Extent to which technical support is offered to help solve product/service issues X9 Complaint Resolution Extent to which any complaints are resolved in a timely and complete manner X10 Advertising Perceptions of HBAT's advertising campaigns in all types of media X11 Product Line Depth and breath of HBAT's product line to meet HSRS 2 HBAT Case description Brief descriptions of the database variables are provided in Table 1-1, in which the variables are classified as either independent or dependent, and either metric or non-metric. A definition of each variable and an explanation of its coding are provided in the following sections. TABLE 1-1 Description of Database variables Variable Description Variable Type Data Warehouse Classification Variables X1 Customer Type Non-metric X2 Industry Type Non-metric X3 Firm Size Non-metric X4 Region Non-metric X5 Distribution System Non-metric Performance Perceptions Variables X6 Product Quality metric X7 E-Commerce Activities/Website metric X8 Technical Support metric X9 Complaint Resolution metric X10 Advertising metric X11 Product Line metric X12 Sales Force Image metric X13 Competitive Pricing metric X14 Warranty and Claims metric X15 New Products metric X16 Ordering and Billing metric X17 Price Flexibility metric X 18 Delivery Speed metric Outcome/ Relationship Measures X19 Satisfaction metric X20 Likelihood of Recommendation metric X21 Likelihood of Future Purchase metric X22 Current Purchase/ Usage Level metric X23 Consider Strategic Alliance/ Partnership in Future Non-metric Data Classification Data Warehouse Classification Variables As respondents were selected for the sample to be used by the marketing research firm, five variables were extracted from HBAT's data warehouse to reflect the basic firm characteristics and their business relationship with HBAT. The five variables are as follows: HSRS 1 HBAT Case description Case Study: HBAT Industries Background HBAT industries (HBAT), is a premium manufacturer of paper products in U.S. Its paper products are used widely in the newsprint industry and the magazine industry both inside and outside of North America. It is a well established company with a fully developed Marketing unit. The company either uses it distribution channels or brokers channel to supply the paper products to the customer. But due to the changing customer perceptions and relationships, the company is facing challenges by newer companies. HBAT management is concerned and wants to change their marketing strategy for the next year to regain its market share. HBAT wants to identify and position itself accordingly to the characteristics of its customers and the relationships between their perceptions of HBAT, and their actions towards HBAT (e.g., satisfaction and likelihood to recommend). To help HBAT marketing unit, the management has hired Crimson Consulting Co. (Crimson). Crimson Consulting Co., is an established marketing research company. It has one of the well established lead-user groups. Crimson collected part of the data set through online surveys of HBAT customers completed on a secure website. Crimson contacts purchasing managers and encourages them to participate. To do so, managers log to the web and finish the survey. The survey data are supplemented by other information compiled and stored in HBAT's data warehouse and accessible through its decision support system. Database The database, consisting of 100 observations on 18 separate variables, is based on a market segmentation study of HBAT customers. As you already know, HBAT sells paper products to two market segments: the newsprint industry and the magazine industry. The paper products are sold to these market segments either directly to the customer, or indirectly through broker. Two types of information were collected in the surveys. The first type of information was perceptions of HBAT's performance on 13 attributes. These attributes, developed through focus groups, a pretest, and variables used in previous studies, are considered to be the most influential in the selection of suppliers in the paper industry. Respondents included purchasing managers of firms buying from HBAT, and they rated HBAT on each of the 13 attributes using a 0-10 scale, with 10 being "Excellent" and 0 being "Poor". The second type of information relates to purchase outcomes and business relationships (e.g., satisfaction with HBAT and whether the firm would consider a strategic alliance / partnership with HBAT). A third type of information is available from HBAT's data warehouse and includes information such as size of customer and length of purchase relationship. Data information and description