1. In a psychological study of short-term memary, irrelevant speech effects refer to the degree to which the Q memorization process is impaired by irrelevant
1.
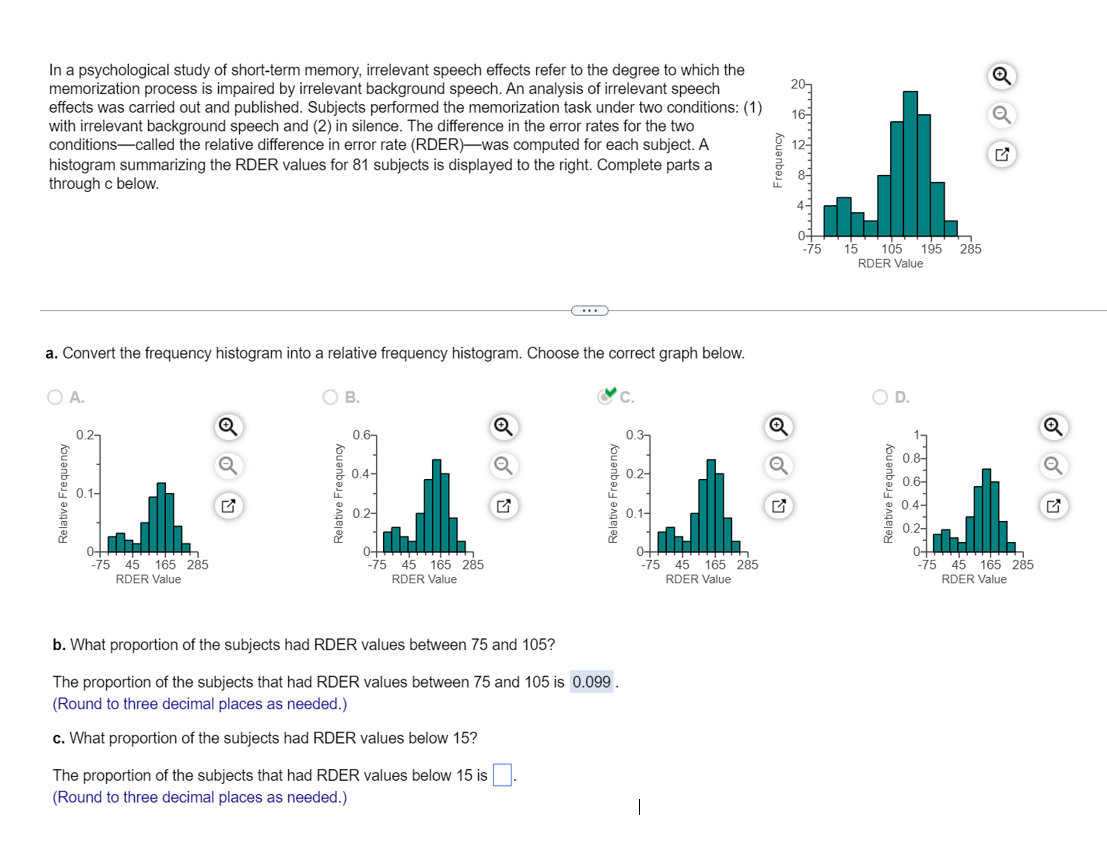
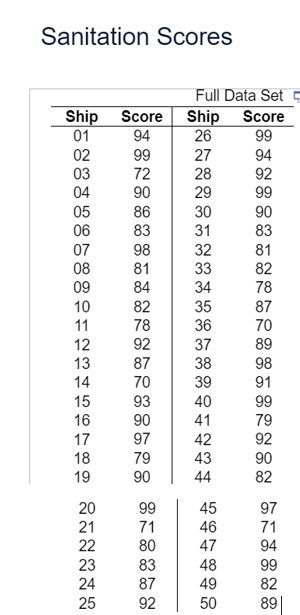
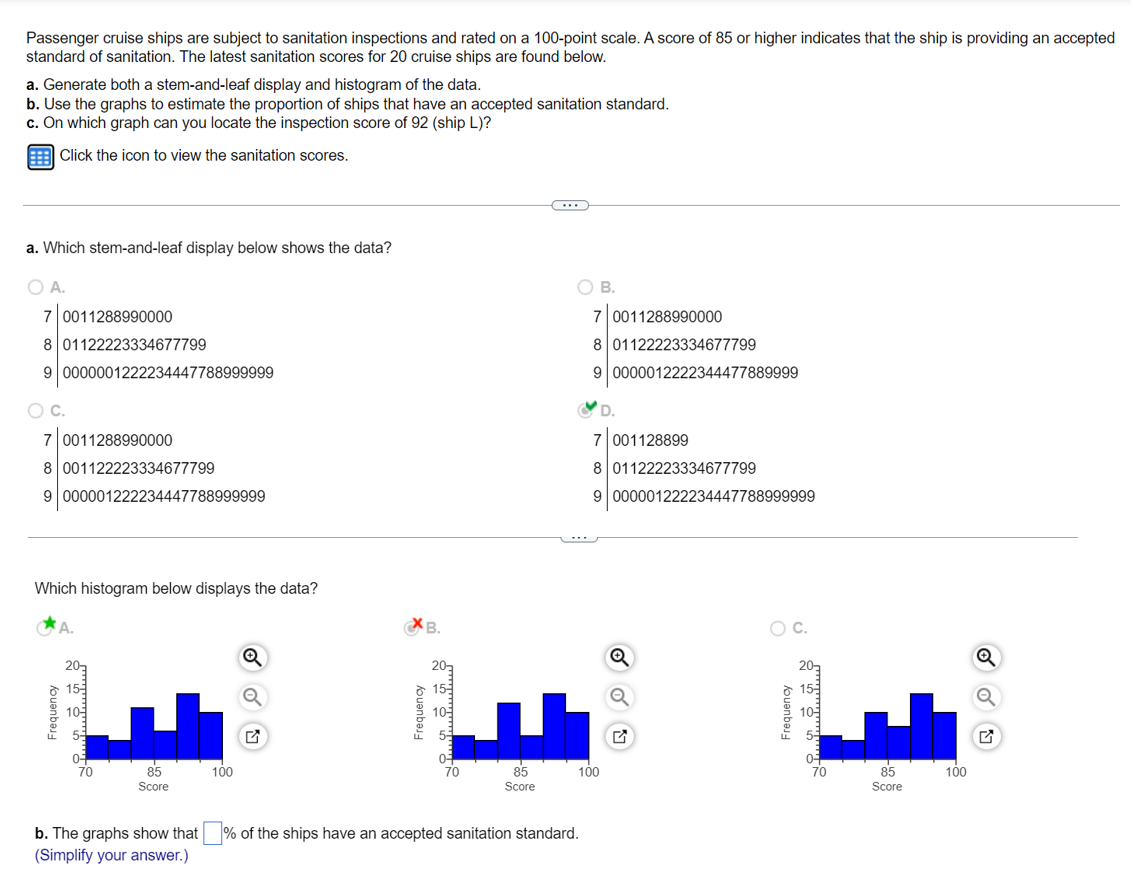
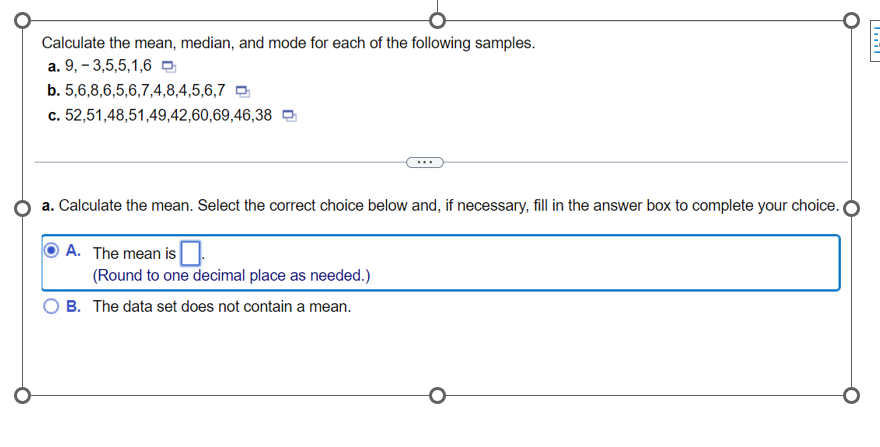
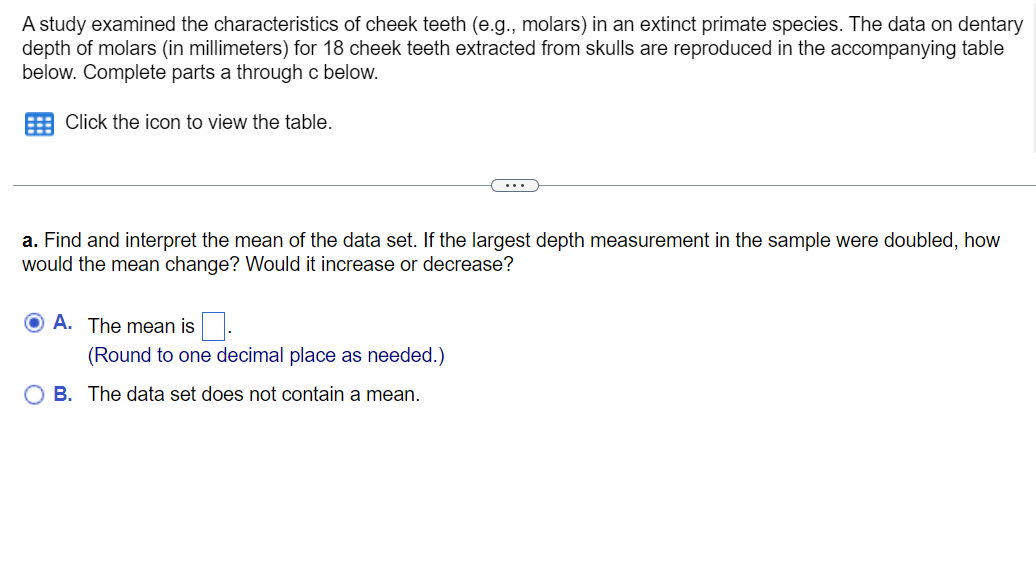
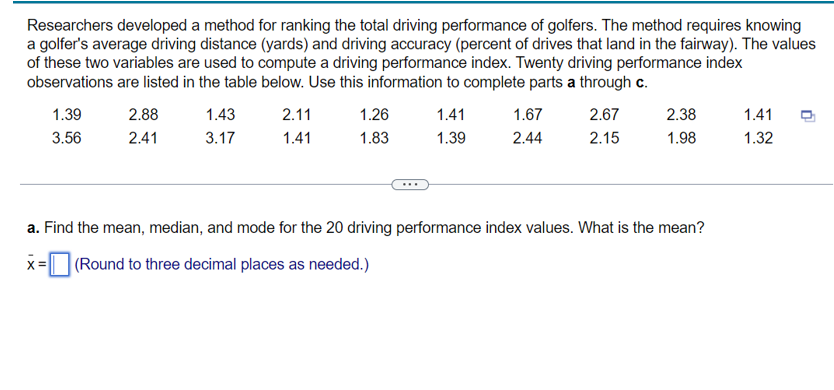
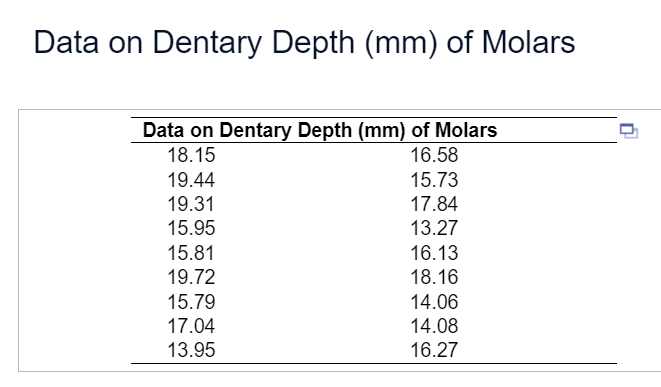
In a psychological study of short-term memary, irrelevant speech effects refer to the degree to which the Q memorization process is impaired by irrelevant background speech. An analysis of irrelevant speech 2 effects was carried out and published. Subjects performed the memorization task under two conditions: (1) 16 Q with irrelevant background speech and (2) in silence. The difference in the error rates for the two conditionscalled the relative difference in error rate (RDER)was computed for each subject. A g 12 > histogram summarizing the RDER values for 81 subjects is displayed to the right. Complete parts a g through below. w 4 0 75 15 105 195 RDER Value 4 wee - a. Convert the frequency histogram into a relative frequency histogram. Choose the correct graph below. v 0.2 Q 0 Q 0 Q 1 Q g g g 2 08 % Q % 0.4 Q % 0.2 Q % 0. Q & 0.1 & i & o 2 02 o 0.1 o g 04 o = s s 3 02 o o i o 0 0 0 715 45 165 285 -75 45 165 285 -75 45 165 285 -75 45 165 285 RDER Value RDER Value RDER Value RDER Value b. What proportion of the subjects had RDER values between 75 and 1057 The proportion of the subjects that had RDER values between 75 and 105is 0.099 . (Round to three decimal places as needed.) . What proportion of the subjects had RDER values below 157 The proportion of the subjects that had RDER values below 15 is U (Round to three decimal places as needed.) \fPassenger cruise ships are subject to sanitation inspections and rated on a 100-point scale. A score of 85 or higher indicates that the ship is providing an accepted standard of sanitation. The latest sanitation scores for 20 cruise ships are found below. a. Generate both a stem-and-leaf display and histogram of the data. b. Use the graphs to estimate the proportion of ships that have an accepted sanitation standard. c. On which graph can you locate the inspection score of 92 (ship L)? 5| Click the icon to view the sanitation scores. a. Which stem-and-leaf display below shows the data? 7 |0011288990000 7 |0011288990000 8|01122223334677799 8|01122223334677799 9|0000001222234447788999999 9|0000012222344477889999 v 7| 0011288990000 71001128899 81001122223334677799 8|01122223334677799 91 000001222234447788999999 91000001222234447788999999 Which histogram below displays the data? * X Q Q Frequency Frequency Frequency = 85 85 85 Score Score Score b. The graphs show that f% of the ships have an accepted sanitation standard. (Simplify your answer.) 0 o o Calculate the mean, median, and mode for each of the following samples. a.9,-35516 o b.56,86,56,7484567 O c. 52,51,48,51,49,42,60,69,46,38 & e () a. Calculate the mean. Select the correct choice below and, if necessary, fill in the answer box to complete your choice. () A. The mean is D (Round to one decimal place as needed.) (O B. The data set does not contain a mean. A study examined the characteristics of cheek teeth (e.g., molars) in an extinct primate species. The data on dentary depth of molars (in millimeters) for 18 cheek teeth extracted from skulls are reproduced in the accompanying table below. Complete parts a through below. FH Click the icon to view the table. a. Find and interpret the mean of the data set. If the largest depth measurement in the sample were doubled, how would the mean change? Would it increase or decrease? A. Themeanis| |- (Round to one decimal place as needed.) () B. The data set does not contain a mean. Researchers developed a method for ranking the total driving performance of golfers. The method requires knowing a golfer's average driving distance (yards) and driving accuracy (percent of drives that land in the fairway). The values of these two variables are used to compute a driving performance index. Twenty driving performance index observations are listed in the table below. Use this information to complete parts a through c. 1.39 2.88 143 2.1 1.26 1.41 1.67 267 2.38 141 3.56 241 347 1.41 1.83 1.39 2.44 215 1.98 1.32 a. Find the mean, median, and mode for the 20 driving performance index values. What is the mean? X :D (Round to three decimal places as needed.) Data on Dentary Depth (mm) of Molars Data on Dentary Depth (mm) of Molars 18.15 16.58 19.44 15.73 19.31 17.84 15.95 13.27 15.81 16.13 19.72 18.16 15.79 14.06 17.04 14.08 13.95 16.27
Step by Step Solution
There are 3 Steps involved in it
Step: 1
Get Instant Access to Expert-Tailored Solutions
See step-by-step solutions with expert insights and AI powered tools for academic success
Step: 2
Step: 3
Ace Your Homework with AI
Get the answers you need in no time with our AI-driven, step-by-step assistance