Answered step by step
Verified Expert Solution
Question
1 Approved Answer
1. In a regression, the R2 Statistic is 0.875 . This means that: (A) 87.5% of the variation of the independent variable is explained by

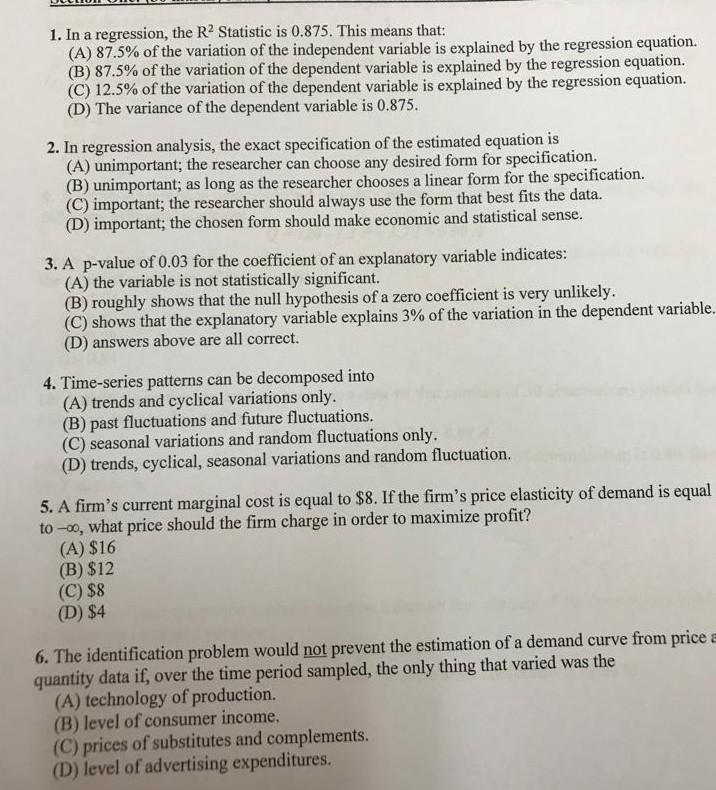
1. In a regression, the R2 Statistic is 0.875 . This means that: (A) 87.5% of the variation of the independent variable is explained by the regression equation. (B) 87.5% of the variation of the dependent variable is explained by the regression equation. (C) 12.5% of the variation of the dependent variable is explained by the regression equation. (D) The variance of the dependent variable is 0.875 . 2. In regression analysis, the exact specification of the estimated equation is (A) unimportant; the researcher can choose any desired form for specification. (B) unimportant; as long as the researcher chooses a linear form for the specification. (C) important; the researcher should always use the form that best fits the data. (D) important; the chosen form should make economic and statistical sense. 3. A p-value of 0.03 for the coefficient of an explanatory variable indicates: (A) the variable is not statistically significant. (B) roughly shows that the null hypothesis of a zero coefficient is very unlikely. (C) shows that the explanatory variable explains 3% of the variation in the dependent variable (D) answers above are all correct. 4. Time-series patterns can be decomposed into (A) trends and cyclical variations only. (B) past fluctuations and future fluctuations. (C) seasonal variations and random fluctuations only. (D) trends, cyclical, seasonal variations and random fluctuation. 5. A firm's current marginal cost is equal to $8. If the firm's price elasticity of demand is equa to , what price should the firm charge in order to maximize profit? (A) $16 (B) $12 (C) $8 (D) $4 6. The identification problem would not prevent the estimation of a demand curve from price quantity data if, over the time period sampled, the only thing that varied was the (A) technology of production. (B) level of consumer income. (C) prices of substitutes and complements. (D) level of advertising expenditures
Step by Step Solution
There are 3 Steps involved in it
Step: 1

Get Instant Access to Expert-Tailored Solutions
See step-by-step solutions with expert insights and AI powered tools for academic success
Step: 2

Step: 3

Ace Your Homework with AI
Get the answers you need in no time with our AI-driven, step-by-step assistance
Get Started


