

Question
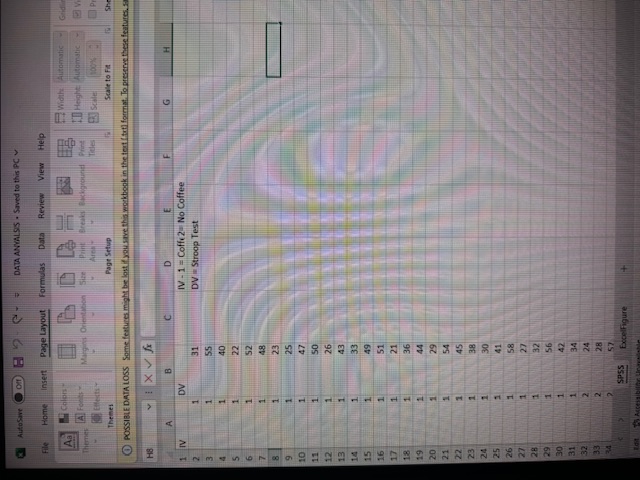
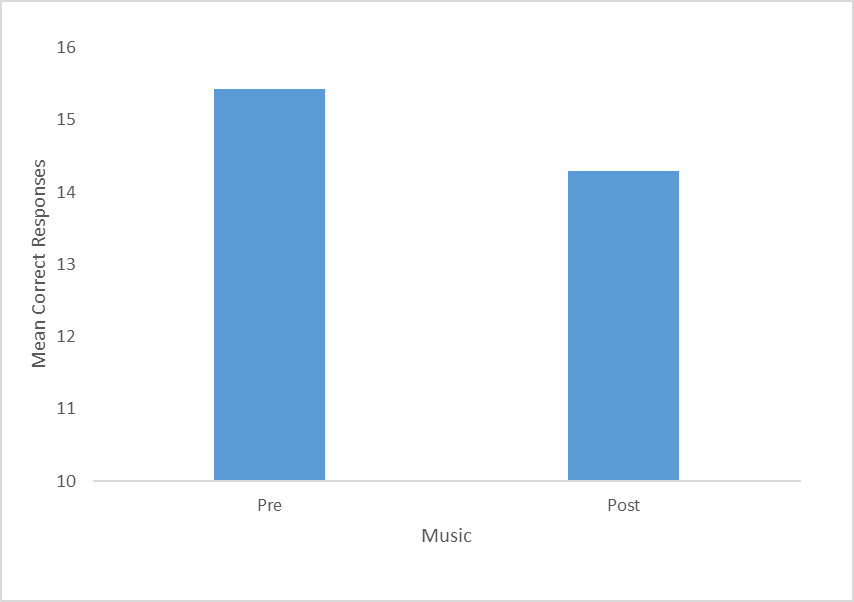
1) In EXCEL: Make a Figure (bar graph) of your means 2) In SPSS: Run analysis to compare groups (using a t-test) with means and
1) In EXCEL: Make a Figure (bar graph) of your means 2) In SPSS: Run analysis to compare groups (using a t-test) with means and standard deviations in output in SPSS 3) Include and upload of your SPSS output. 4) Write results section in AP(A) format. Make sure you include: a. PARAGRAPH i. The type of analysis you ran (t-test, ANOVA, chi-square ...) ii. Your alpha level iii. A description of the outcome in "plain English" iv. The means and standard deviation v. Your significance test in the correct format b. A bar graph of results in AP(A)format -t he Excel figure copied and pasted into Word with Figure caption below and labeled axes. Turn in all of the above making sure your name is on each sheet. Including SPSS upload.
Ensure: This criterion is linked to a Learning Outcome Analysis is Accurate. The numbers in paragraph are all reported and accurate to SPSS output. This includes Ns, Means, SDs, alpha, t, df, p, and whether it was significant or not.
SPSS is Accurate. SPSS output is accurate. The appropriate test is used (independent-samples t-test). Includes both the statistics and t-test output.
Graph/Table in AP(A) format Proper graph format is used (for t-tests, that's a bar graph with two bars). All other info and AP(A) styling are included. This includes axis labels with both group names (x-axis) and scores (y-axis), figure label (Figure 1), and figure title (outside of the graph).
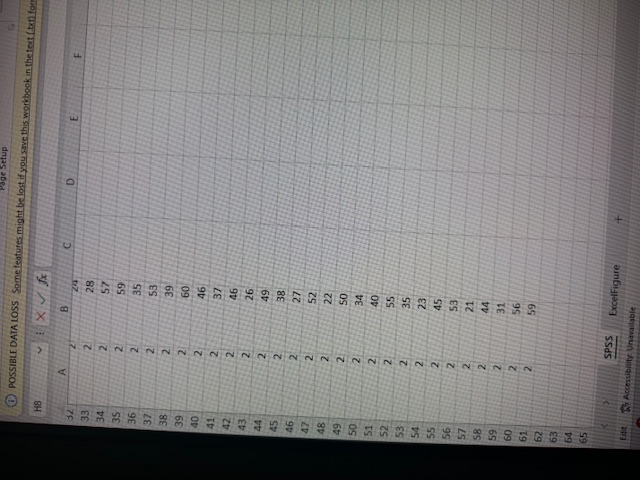
DATA BELOW
Step by Step Solution
There are 3 Steps involved in it
Step: 1

Get Instant Access to Expert-Tailored Solutions
See step-by-step solutions with expert insights and AI powered tools for academic success
Step: 2

Step: 3
Ace Your Homework with AI
Get the answers you need in no time with our AI-driven, step-by-step assistance
Get Started
Mathematical Applications for the Management Life and Social Sciences
Authors: Ronald J. Harshbarger, James J. Reynolds
11th edition
9781337032247, 9781305465183, 1305108043, 1337032247, 1305465180, 978-1305108042