

Question
1. In figure 3, what type of graph you can see? What are variables and what type of data they have collected? Mention all the
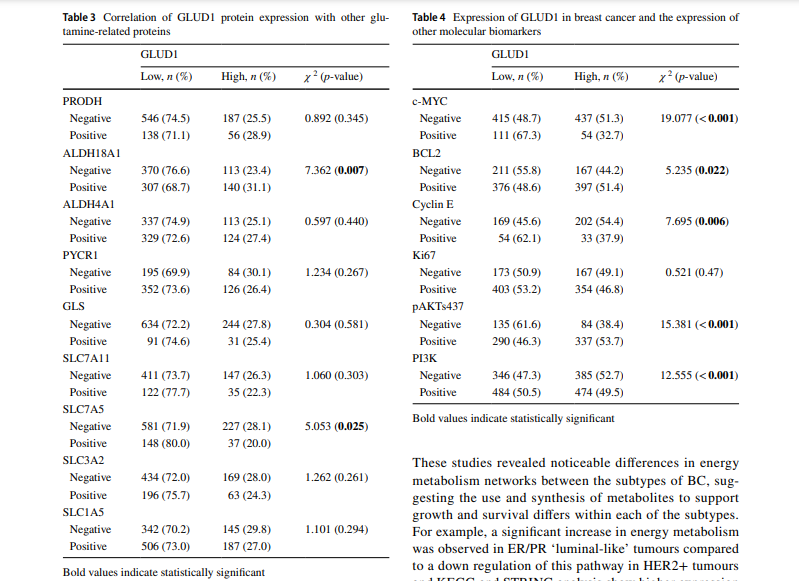
1. In figure 3, what type of graph you can see? What are variables and what type of data they have collected? Mention all the variables with subgroups. What are the p values you can see? Are they significant? How you interpret the result? 2. In table 3 and 4, what are the titles of the tables? Reading the table title what do you think what will be presented in this table? 3. In table 3 and 4, what are the dependent variables you can see? What types of data they have collected? If categorical then mention the categories and if continuous then mention the mean 4. In table 3 and 4, what are the independent variables you can see? What types of data they have collected? If categorical then mention the categories and if continuous then mention the mean 5. In table 3 and 4, what do you think what test has been used to see the relationship among the variables? Which independent variables seem to be significantly associated with dependent variables? Seeing which value, you are determining the significant association?
.n(%) n Table 3 Correlation of GLUDI protein expression with other glu- tamine-related proteins GLUDI Lown High, n (%) x? (p-value) PRODH Negative 546 (74.5) 187 (25.5) 0.892 (0.345) Positive 138 (71.1) 56 (28.9) ALDH18A1 Negative 370 (76.6) 113 (23.4) 7.362 (0.007) Positive 307 (68.7) 140 (31.1) ALDH4A1 Negative 337 (74.9) 113 (25.1) 0.597 (0.440) Positive 329 (72.6) 124 (27.4) PYCR1 Negative 195 (69.9) 84 (30.1) 1.234 (0.267) Positive 352 (73.6) 126 (26.4) GLS Negative 634 (72.2) 244 (27.8) 0.304 (0.581) Positive 91 (74.6) 31 (25.4) SLC7A11 Negative 411 (73.7) 147 (26.3) 1.060 (0.303) Positive 122 (77.7) 35 (22.3) SLCZAS Negative 581 (71.9) 227 (28.1) 5.053 (0.025) Positive 148 (80.0) 37 (20.0) SLC3A2 Negative 434 (72.0) 169 (28.0) 1.262 (0.261) Positive 196 (75.7) 63 (24.3) SLCIAS Negative 342 (70.2) 145 (29.8) 1.101 (0.294) Positive 506 (73.0) 187 (27.0) Table 4 Expression of GLUDI in breast cancer and the expression of other molecular biomarkers GLUDI Low, n (%) High, n (%) x? (p-value) C-MYC Negative 415 (48.7) 437 (51.3) 19.077 (Step by Step Solution
There are 3 Steps involved in it
Step: 1

Get Instant Access to Expert-Tailored Solutions
See step-by-step solutions with expert insights and AI powered tools for academic success
Step: 2

Step: 3
Ace Your Homework with AI
Get the answers you need in no time with our AI-driven, step-by-step assistance
Get Started
Accounting Ethics
Authors: Ronald F. Duska, Brenda Shay Duska, Julie Anne Ragatz
2nd Edition
1405196130, 978-1405196130