

1. In the Microsoft Excel document included with your exam materials you will find a spreadsheet titled Des Moines Apts containing information about apartments
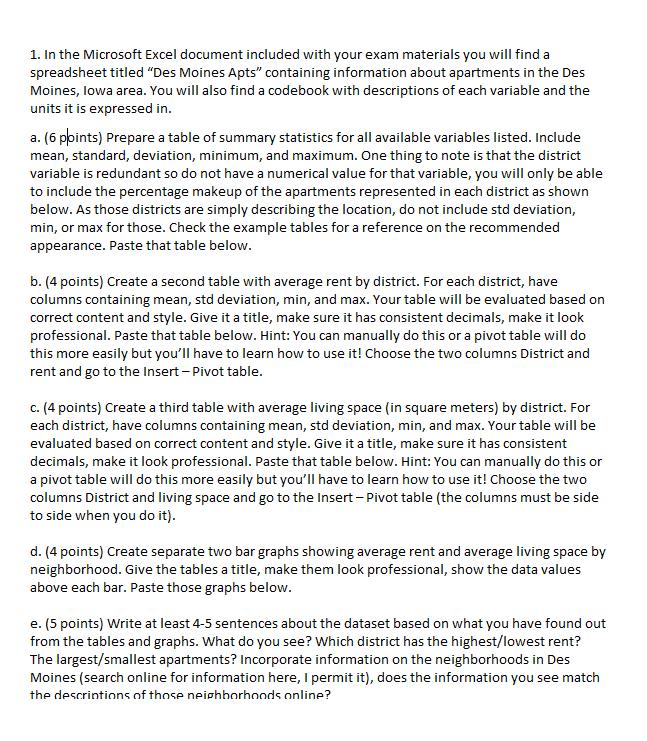
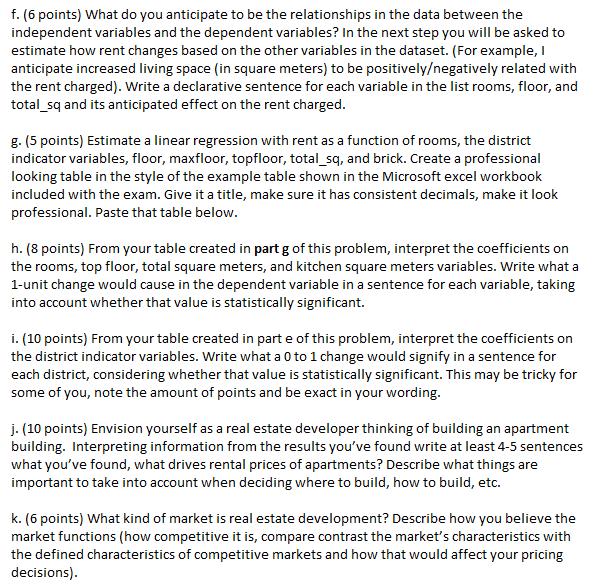
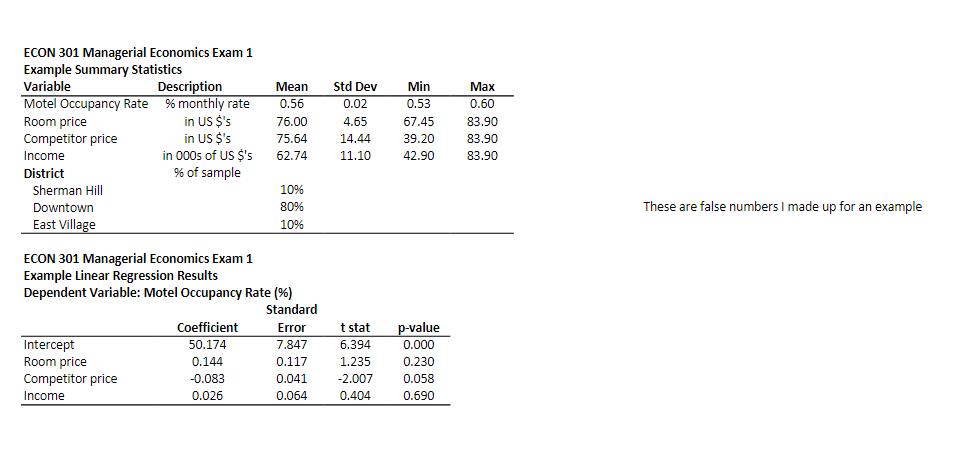
1. In the Microsoft Excel document included with your exam materials you will find a spreadsheet titled "Des Moines Apts" containing information about apartments in the Des Moines, Iowa area. You will also find a codebook with descriptions of each variable and the units it is expressed in. a. (6 points) Prepare a table of summary statistics for all available variables listed. Include mean, standard, deviation, minimum, and maximum. One thing to note is that the district variable is redundant so do not have a numerical value for that variable, you will only be able to include the percentage makeup of the apartments represented in each district as shown below. As those districts are simply describing the location, do not include std deviation, min, or max for those. Check the example tables for a reference on the recommended appearance. Paste that table below. b. (4 points) Create a second table with average rent by district. For each district, have columns containing mean, std deviation, min, and max. Your table will be evaluated based on correct content and style. Give it a title, make sure it has consistent decimals, make it look professional. Paste that table below. Hint: You can manually do this or a pivot table will do this more easily but you'll have to learn how to use it! Choose the two columns District and rent and go to the Insert - Pivot table. c. (4 points) Create a third table with average living space (in square meters) by district. For each district, have columns containing mean, std deviation, min, and max. Your table will be evaluated based on correct content and style. Give it a title, make sure it has consistent decimals, make it look professional. Paste that table below. Hint: You can manually do this or a pivot table will do this more easily but you'll have to learn how to use it! Choose the two columns District and living space and go to the Insert - Pivot table (the columns must be side to side when you do it). d. (4 points) Create separate two bar graphs showing average rent and average living space by neighborhood. Give the tables a title, make them look professional, show the data values above each bar. Paste those graphs below. e. (5 points) Write at least 4-5 sentences about the dataset based on what you have found out from the tables and graphs. What do you see? Which district has the highest/lowest rent? The largest/smallest apartments? Incorporate information on the neighborhoods in Des Moines (search online for information here, I permit it), does the information you see match the descriptions of those neighborhoods online? f. (6 points) What do you anticipate to be the relationships in the data between the independent variables and the dependent variables? In the next step you will be asked to estimate how rent changes based on the other variables in the dataset. (For example, I anticipate increased living space (in square meters) to be positively/negatively related with the rent charged). Write a declarative sentence for each variable in the list rooms, floor, and total_sq and its anticipated effect on the rent charged. g. (5 points) Estimate a linear regression with rent as a function of rooms, the district indicator variables, floor, maxfloor, topfloor, total_sq, and brick. Create a professional looking table in the style of the example table shown in the Microsoft excel workbook included with the exam. Give it a title, make sure it has consistent decimals, make it look professional. Paste that table below. h. (8 points) From your table created in part g of this problem, interpret the coefficients on the rooms, top floor, total square meters, and kitchen square meters variables. Write what a 1-unit change would cause in the dependent variable in a sentence for each variable, taking into account whether that value is statistically significant. i. (10 points) From your table created in part e of this problem, interpret the coefficients on the district indicator variables. Write what a 0 to 1 change would signify in a sentence for each district, considering whether that value is statistically significant. This may be tricky for some of you, note the amount of points and be exact in your wording. j. (10 points) Envision yourself as a real estate developer thinking of building an apartment building. Interpreting information from the results you've found write at least 4-5 sentences what you've found, what drives rental prices of apartments? Describe what things are important to take into account when deciding where to build, how to build, etc. k. (6 points) What kind of market is real estate development? Describe how you believe the market functions (how competitive it is, compare contrast the market's characteristics with the defined characteristics of competitive markets and how that would affect your pricing decisions). ECON 301 Managerial Economics Exam 1 Example Summary Statistics Variable Motel Occupancy Rate Room price Competitor price Income District Sherman Hill Downtown East Village Description % monthly rate in US $'s Intercept Room price Competitor price Income in US $'s in 000s of US $'s % of sample Mean 0.56 76.00 Coefficient 50.174 0.144 -0.083 0.026 75.64 62.74 ECON 301 Managerial Economics Exam 1 Example Linear Regression Results Dependent Variable: Motel Occupancy Rate (%) Standard 10% 80% 10% Std Dev 0.02 4.65 14.44 11.10 Error 7.847 0.117 0.041 -2,007 0.064 0.404 t stat p-value 0.000 0.230 0.058 0.690 Min 0.53 67.45 39.20 42.90 6.394 1.235 Max 0.60 83.90 83.90 83.90 These are false numbers I made up for an example
Step by Step Solution
3.52 Rating (159 Votes )
There are 3 Steps involved in it
Step: 1

See step-by-step solutions with expert insights and AI powered tools for academic success
Step: 2

Step: 3
Ace Your Homework with AI
Get the answers you need in no time with our AI-driven, step-by-step assistance
Get Started
Authors: Richard Brealey, Stewart Myers, Alan Marcus
8th edition
77861620, 978-0077861629