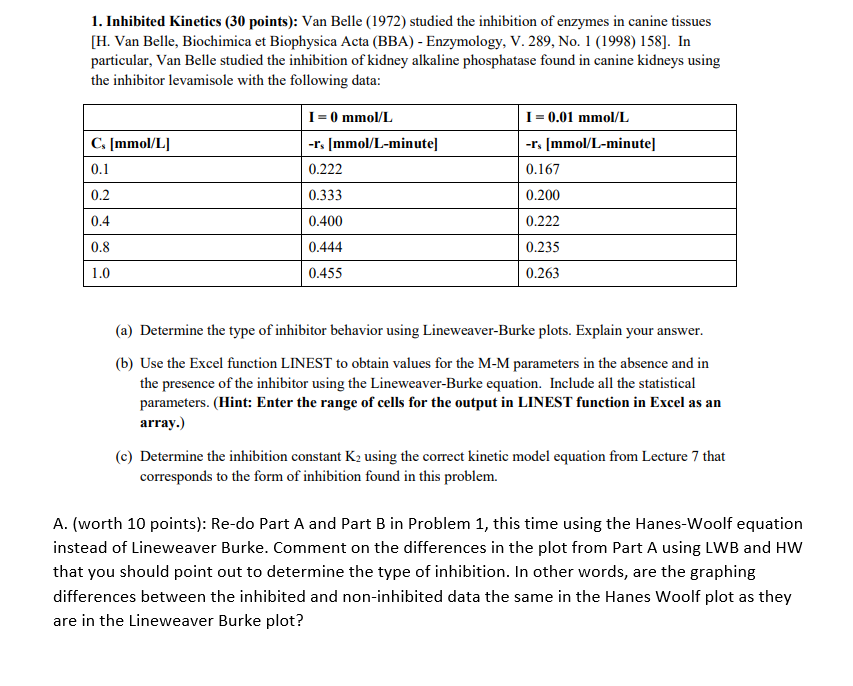
1. Inhibited Kinetics (30 points): Van Belle (1972) studied the inhibition of enzymes in canine tissues [H. Van Belle, Biochimica et Biophysica Acta (BBA) - Enzymology, V. 289, No. 1 (1998) 158]. In particular, Van Belle studied the inhibition of kidney alkaline phosphatase found in canine kidneys using the inhibitor levamisole with the following data: (a) Determine the type of inhibitor behavior using Lineweaver-Burke plots. Explain your answer. (b) Use the Excel function LINEST to obtain values for the M-M parameters in the absence and in the presence of the inhibitor using the Lineweaver-Burke equation. Include all the statistical parameters. (Hint: Enter the range of cells for the output in LINEST function in Excel as an array.) (c) Determine the inhibition constant K2 using the correct kinetic model equation from Lecture 7 that corresponds to the form of inhibition found in this problem. A. (worth 10 points): Re-do Part A and Part B in Problem 1, this time using the Hanes-Woolf equation instead of Lineweaver Burke. Comment on the differences in the plot from Part A using LWB and HW that you should point out to determine the type of inhibition. In other words, are the graphing differences between the inhibited and non-inhibited data the same in the Hanes Woolf plot as they are in the Lineweaver Burke plot? 1. Inhibited Kinetics (30 points): Van Belle (1972) studied the inhibition of enzymes in canine tissues [H. Van Belle, Biochimica et Biophysica Acta (BBA) - Enzymology, V. 289, No. 1 (1998) 158]. In particular, Van Belle studied the inhibition of kidney alkaline phosphatase found in canine kidneys using the inhibitor levamisole with the following data: (a) Determine the type of inhibitor behavior using Lineweaver-Burke plots. Explain your answer. (b) Use the Excel function LINEST to obtain values for the M-M parameters in the absence and in the presence of the inhibitor using the Lineweaver-Burke equation. Include all the statistical parameters. (Hint: Enter the range of cells for the output in LINEST function in Excel as an array.) (c) Determine the inhibition constant K2 using the correct kinetic model equation from Lecture 7 that corresponds to the form of inhibition found in this problem. A. (worth 10 points): Re-do Part A and Part B in Problem 1, this time using the Hanes-Woolf equation instead of Lineweaver Burke. Comment on the differences in the plot from Part A using LWB and HW that you should point out to determine the type of inhibition. In other words, are the graphing differences between the inhibited and non-inhibited data the same in the Hanes Woolf plot as they are in the Lineweaver Burke plot


