Answered step by step
Verified Expert Solution
Link Copied!

Question

1 Approved Answer

1. Interpret (explain) the following graph. Explain why each curve has its particular shape in relation to the x and yaxis and to each of
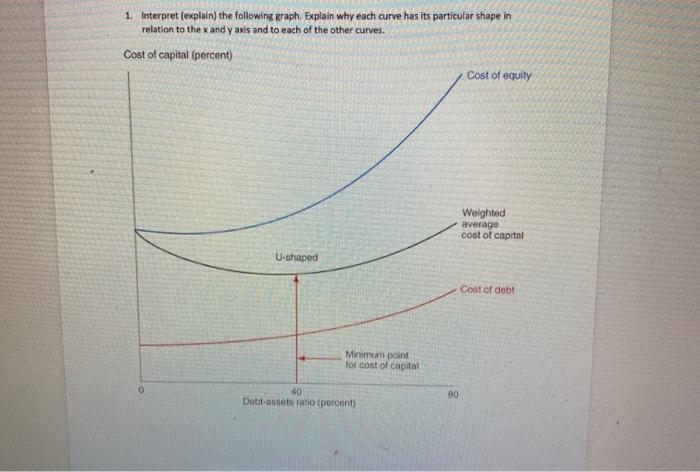
image text in transcribed
1. Interpret (explain) the following graph. Explain why each curve has its particular shape in relation to the x and yaxis and to each of the other curves. Cost of capital (percent) Cost of equity Weighted average cost of capital U-shaped Cost of debt Minimum point for cost of capital 40 Debt-assets ratio (percent)

Step by Step Solution

There are 3 Steps involved in it

Step: 1

blur-text-image

Get Instant Access to Expert-Tailored Solutions

See step-by-step solutions with expert insights and AI powered tools for academic success

Step: 2

blur-text-image

Step: 3

blur-text-image

Ace Your Homework with AI

Get the answers you need in no time with our AI-driven, step-by-step assistance

Get Started

Recommended Textbook for

Multinational Business Finance

Authors: David K. Eiteman, Arthur I. Stonehill, Michael H. Moffett

13th edition

132743469, 978-0132743464

More Books

Students also viewed these Finance questions

Question

Socratic method ?

Answered: 1 week ago