Question
1. Introduction Schneider, a French electrical manufacturer, has long had an interest in acquiring Square D, a US-based firm in the same industry. However, Square
1. Introduction
Schneider, a French electrical manufacturer, has long had an interest in acquiring Square D, a US-based firm in the same industry. However, Square D's management and Board of Directors have always been strongly opposed to any merger of the two companies. In late 1990, Square D appears to be in play, and Schneider has to decide whether to make an offer for the company.
The below notes describe the strategic, financial, and valuation tools that were used to determine what Square D is worth to Schneider, how Schneider might acquire the company, and the effects of alternative merger accounting methods.
2. A brief description of the two companies
Schneider was established in France in 1836 by the brothers Schneider, by acquiring a firm that sold iron, steel, and build railways and ships. It soon became a leading weapons manufacturer. During 1940-1950 it entered telephone equipment business. By 1980, it is a financial conglomerate that does everything. In 1981 it divests loss-making segments and focuses on electrical equipment, power distribution and electrical building contracts. In 1988, it acquires Telemecanique (14,500 employees, $1.5b revenue). In 1986 it controls Merlin Gerin (34,000 employees and $4b revenue). In 1991, turns to international diversification and focuses on Square D to find a way into the US market. Schneider has established a reputation of aggressiveness to growth particularly through hostile takeovers.
Square D was once Detroit Fuse and Manufacturing (est. 1902) and remained as a major US supplier of electrical distribution and industrial control equipment. Despite 59 profitable years, in the mid 1980s Square Ds performance starts to fall. Square D changes management, which leads to large scale restructuring some US and Canadian facilities close down and other facilities consolidate. The business refocuses and centralises operations. By 1991, Square D had 18,500 employees and annual revenue $1.65b USD
In November 1990, Square D is in the middle of restructuring when unusual activity is noticed in its stock following rumours of takeover from Schneider within a month the price goes up from $36.50 to $49.75 (i.e. 36.30% stock return in just one month). In 1991, the US economy goes into deep recession and Square D is now vulnerable. Now is the time for Schneider to decide whether to materialise its long-term interest and make an offer for the Square D.
2. Strategic Rationale for a Combination of Schneider and Square There is strong economic justification for a combination between Schneider and Square D. Historically, the industry has been segmented by country or region. Barriers to entry in these different markets have been perpetuated by
(1) differences in standards across countries and regions,
(2) costs of R&D for new products and costs of translating technologies for different regional standards, and
(3) proprietary distribution networks such as those of Square D. Industry trends point towards increased globalization:
Product standards are becoming common across regions. European standards are increasingly dominant in Southeast Asia. International standards IEC (International Electrotechnical Commission) are increasingly replacing American standards NEMA (National Electrical Manufacturers Association) throughout the world, although it seems optimistic to believe that US standards will change any time soon.
R&D costs continue to grow, increasing the benefits of economies of scale for the key firms in the industry. The development cost of a new product is between 250 and 400 million FF. Also, R&D potential grows substantially for Schneider, as the French government releases generous subsidies to boost French competition. Given the above factors, Schneider and Square D appear to be a good match and this is a good timing for the takeover. Schneider is a leader in Europe, whereas Square D is a major player in the US market. Also, the two firms strategies and product strengths are highly complementary: Schneider appears to be especially strong in industrial distribution, while Square D is strongest in residential distribution. Key synergies from the combination would include the following:
Rationalizing R&D efforts for the two companies and sharing the benefits of existing technologies. This implies that R&D spending for the combined firm would be less than that for the two firms as independent entities. Also, sharing technologies would increase sales for the combined firm.
Access to larger distribution channels for both companies, potentially lowering marketing costs and increasing sales. Could this be achieved without a merger through some form of licensing agreement? Rationalizing manufacturing capabilities, potentially lowering manufacturing costs and transportation costs.
Widening Square D's product line by using its distribution network to sell products developed by Tlmcanique and Merlin Gerin in the US, the largest market in the world. This should lead to increased sales for the combined firm. One key concern is the possibility of sales cannibalization for the two firms. That is, growth by Schneider in the US may come at the expense of Square D and vice versa.
3. Assumptions made by Schneider Schneider made the following assumptions for valuing Square D as an independent company regardless of the intended acquisition:
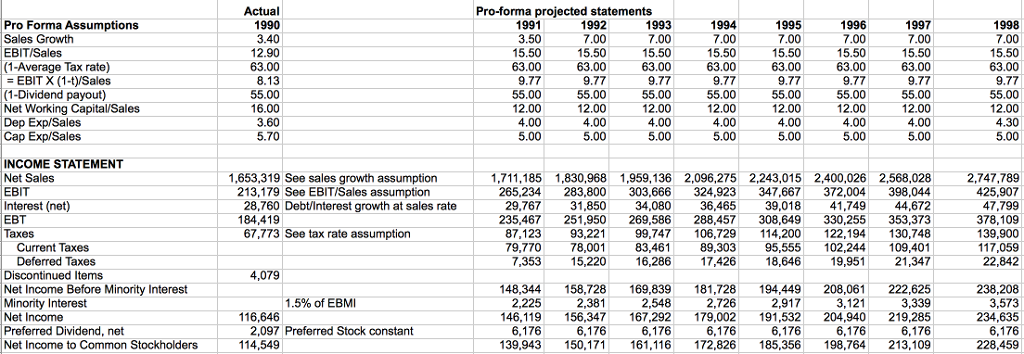
Sales are expected to grow 3.5% in 1991 and stay on average 7% thereafter.
EBIT forecasts are 15-16% of sales. Net Working Capital requirements would be kept at 11-13% of sales.
Projected Capital Expenditures would be 5% of sales.
Depreciation Expenses were expected to stay at 4% of sales between 1991 and 1997, and 4.3% thereafter. Prior years' financial performance for these rates, based on Square D's continuing operations, is summarized in the following table:

Consider the following observations from the historical performance:
Performance (EBIT/Sales) declines due to the timing of restructure with the unanticipated recession. Square D's EBIT/Sales ratio declines steadily over the sample period, from 17 to around 12. Despite the recession, there is a modest upturn in 1990, as the firm's restructuring efforts are paying off.
Working capital/Sales steadily declines until 1990, probably reflecting the company's efforts to improve cash management as part of its restructuring. In 1990 there is a large increase, due to the strategic build-up in cash.
Capital expenditure/Sales declines dramatically in 1987, as the firm responds to the deterioration in its business by cutting back on new capital. Post acquisition, Schneider estimates major cost savings synergies from shutting down overlapping facilities that would save $60m after tax for every year following the merger, in perpetuity.
4. Pro Forma Financial Statements
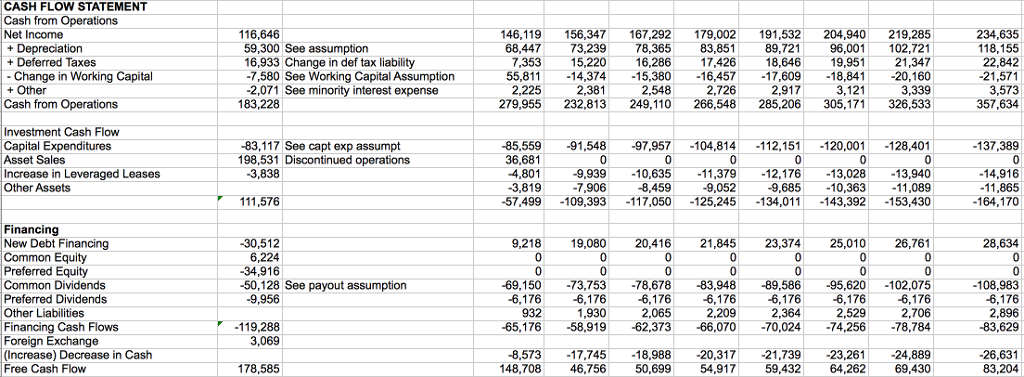
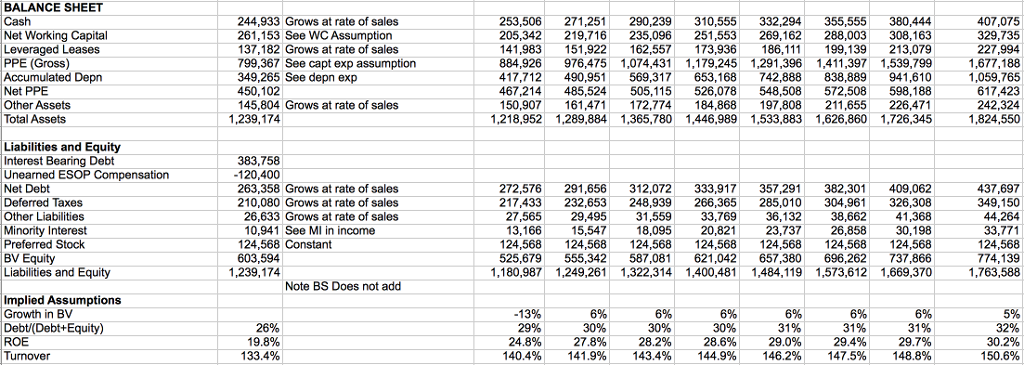
Using Schneiders assumptions and its 1990 financial statements we can construct proforma financial statements, which are provided below.
5. Computation of Square D's Cost of Equity
The Equity beta based on Value Line Investments Survey is 0.95%. In early 1991, the 30 year Government Treasuries is 8.25%. Assuming a market risk premium of 8% the cost of equity for Square D is as follows: re = rf + be (rm rf ) = 8.25 + 0.95 8 = 15.9
6. DCF valuation
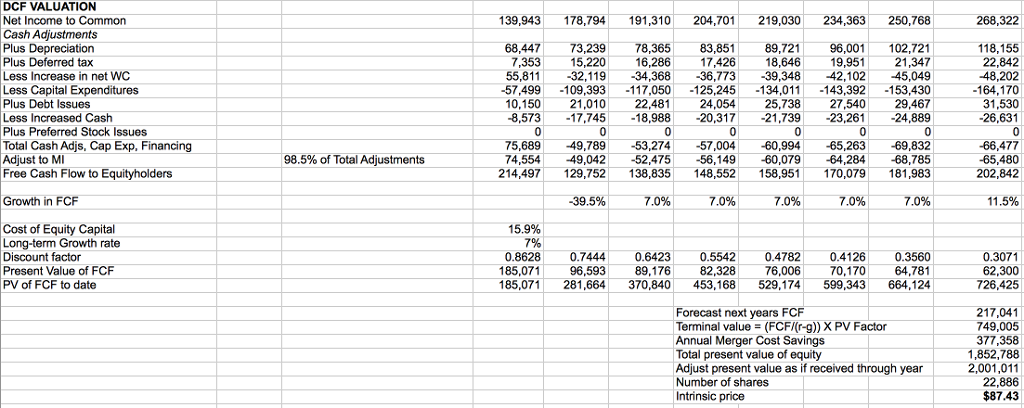
Schneider applied the discounted cash flow model using the aforementioned assumptions to value the equity acquisition of Squared D. This valuation is provided on the Excel Spreadsheet on Blackboard.
Using the 15.9 cost of equity and a long-term growth rate of cash flows of 7, we can discount the equity cash flows and abnormal earnings from 1991 to 1998. The detailed diagrams below show the computations using Schneider's assumptions. The market value of equity is $1,981 million and the stock is worth approximately $86.60. This value is substantially higher than the stock price before any takeover rumors ($40-$45). It includes Schneider's estimate of cost savings from the merger of $60 million after tax per year. At a 15.9 cost of equity, this perpetuity is valued at $405,000 (adjusted as if received throughout the year). If the annual savings increase at the same rate as sales growth, the market value increases to around $100.
The additional $150 million cash currently held by Square D are already built into the valuation, since the DCF method discounts interest income on this excess cash. Certainly Schneider can gain access to this excess cash after an acquisition, but there are typically no synergies from acquiring cash. Of course, if Square D's management were likely to waste the excess cash in building defenses, whereas Schneider assumes in the DCF valuation that the cash would create value by ensuring that the cash were either paid out or reinvested in profitable projects.
Assuming that Square D's price before the effects of any merger rumors is $45, the firm's price-earnings ratio is about 9.5 (based on EPS from continuing operations of $4.76). Given Schneider's assumption of operating savings of $60 million per year, the stock should be worth about $69 (= $45 + [9.5 $60 million/23.181 million shares]) to Schneider.
Required
(1) Critically evaluate the assumptions made by Schneider for valuing Square D. Are they reasonable? If not why so?
(2) Using what you learned in ACCT30130, critically revise the assumptions made by Schneider and provide estimates that may seem to be more reasonable for you. Explain your choices.
(3) Re-estimate the DCF model and calculate the intrinsic price. Also estimate the RIV model and calculate the intrinsic price.
Step by Step Solution
There are 3 Steps involved in it
Step: 1

Get Instant Access to Expert-Tailored Solutions
See step-by-step solutions with expert insights and AI powered tools for academic success
Step: 2

Step: 3

Ace Your Homework with AI
Get the answers you need in no time with our AI-driven, step-by-step assistance
Get Started


