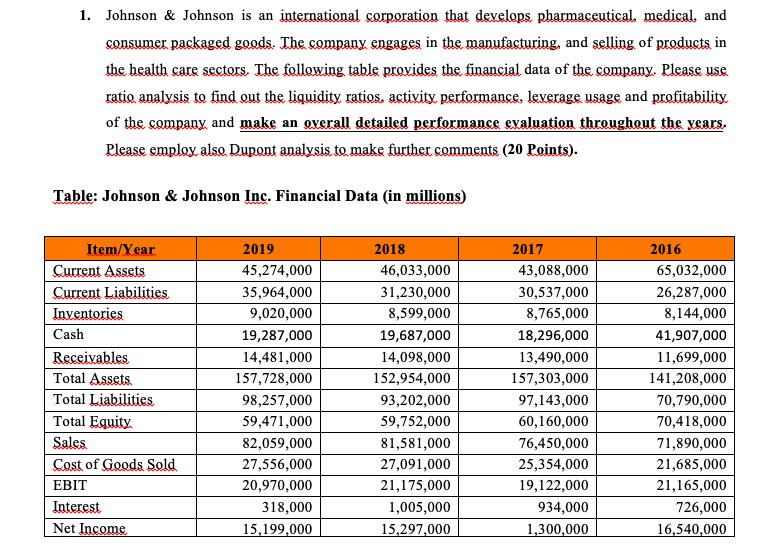
1. Johnson & Johnson is an international corporation that develops pharmaceutical, medical, and consumer packaged goods. The company engages in the manufacturing, and selling of products in the health care sectors. The following table provides the financial data of the company. Please use ratio analysis to find out the liquidity ratios, activity performance, leverage usage and profitability of the company and make an overall detailed performance evaluation throughout the years, Please employ also Dupont analysis to make further comments (20 Points). Table: Johnson & Johnson Inc. Financial Data (in millions) Item/Year Current Assets Current Liabilities Inventories Cash Receivables Total Assets Total Liabilities Total Equity Sales. Cost of Goods Sold EBIT Interest Net Income 2019 45,274,000 35,964,000 9,020,000 19,287,000 14,481,000 157,728,000 98,257,000 59,471,000 82,059,000 27,556,000 20,970,000 318,000 15,199,000 2018 46,033,000 31,230,000 8,599,000 19,687,000 14,098,000 152,954,000 93,202,000 59,752,000 81,581,000 27,091,000 21,175,000 1,005,000 15,297,000 2017 43,088,000 30,537,000 8,765,000 18,296,000 13,490,000 157,303,000 97,143,000 60,160,000 76,450,000 25,354,000 19,122,000 934,000 1,300,000 2016 65,032,000 26,287,000 8,144,000 41,907,000 11,699,000 141,208,000 70,790,000 70,418,000 71,890,000 21,685,000 21,165,000 726,000 16,540,000 1. Johnson & Johnson is an international corporation that develops pharmaceutical, medical, and consumer packaged goods. The company engages in the manufacturing, and selling of products in the health care sectors. The following table provides the financial data of the company. Please use ratio analysis to find out the liquidity ratios, activity performance, leverage usage and profitability of the company and make an overall detailed performance evaluation throughout the years, Please employ also Dupont analysis to make further comments (20 Points). Table: Johnson & Johnson Inc. Financial Data (in millions) Item/Year Current Assets Current Liabilities Inventories Cash Receivables Total Assets Total Liabilities Total Equity Sales. Cost of Goods Sold EBIT Interest Net Income 2019 45,274,000 35,964,000 9,020,000 19,287,000 14,481,000 157,728,000 98,257,000 59,471,000 82,059,000 27,556,000 20,970,000 318,000 15,199,000 2018 46,033,000 31,230,000 8,599,000 19,687,000 14,098,000 152,954,000 93,202,000 59,752,000 81,581,000 27,091,000 21,175,000 1,005,000 15,297,000 2017 43,088,000 30,537,000 8,765,000 18,296,000 13,490,000 157,303,000 97,143,000 60,160,000 76,450,000 25,354,000 19,122,000 934,000 1,300,000 2016 65,032,000 26,287,000 8,144,000 41,907,000 11,699,000 141,208,000 70,790,000 70,418,000 71,890,000 21,685,000 21,165,000 726,000 16,540,000