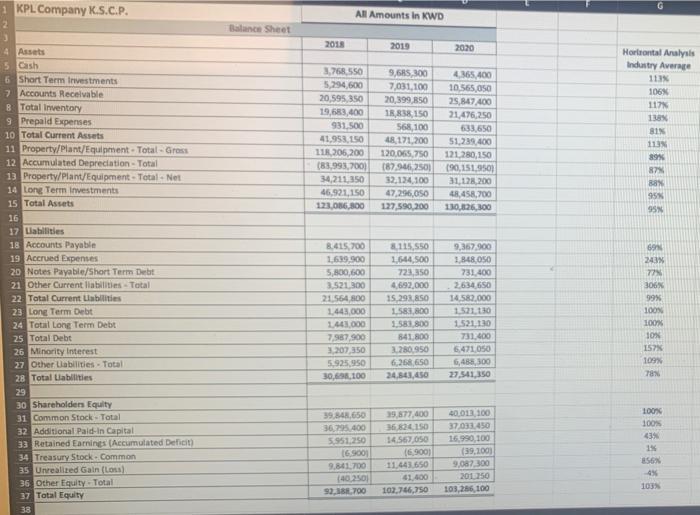
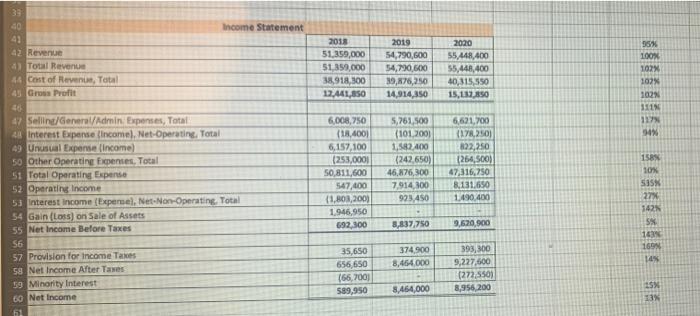
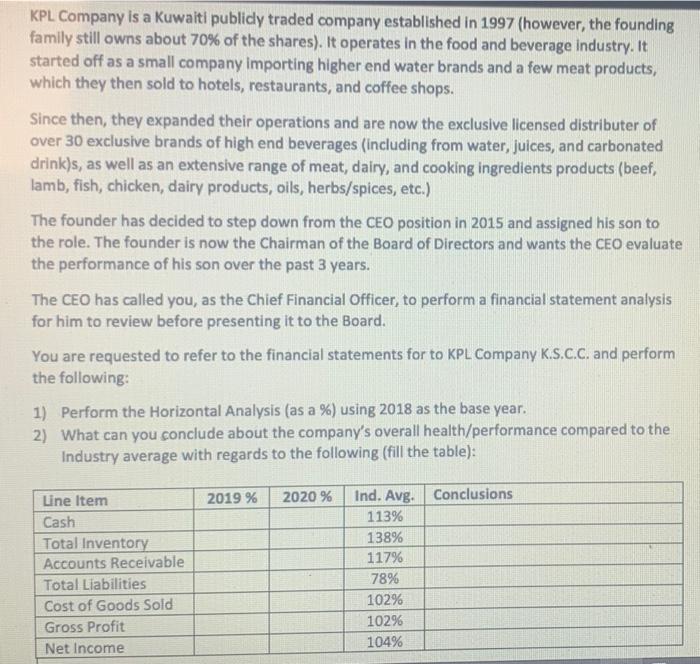
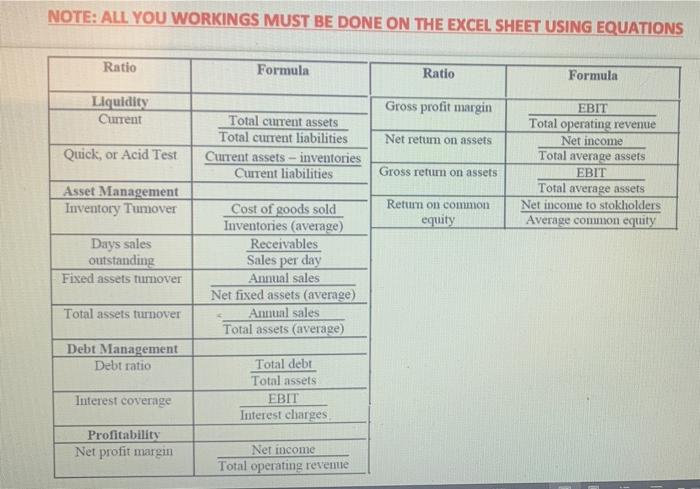
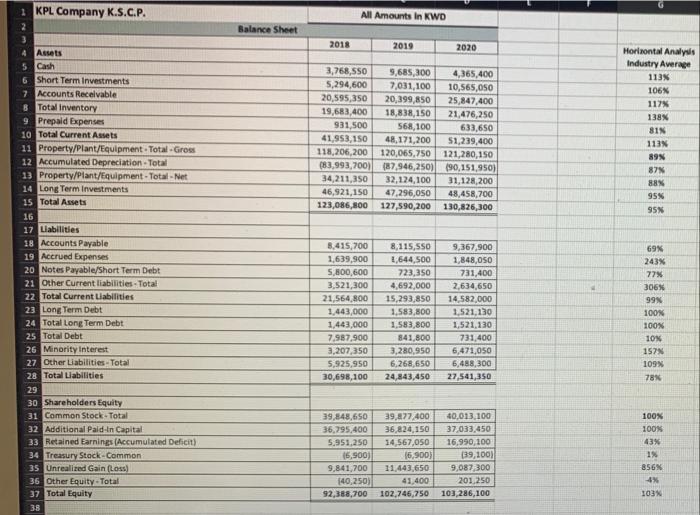
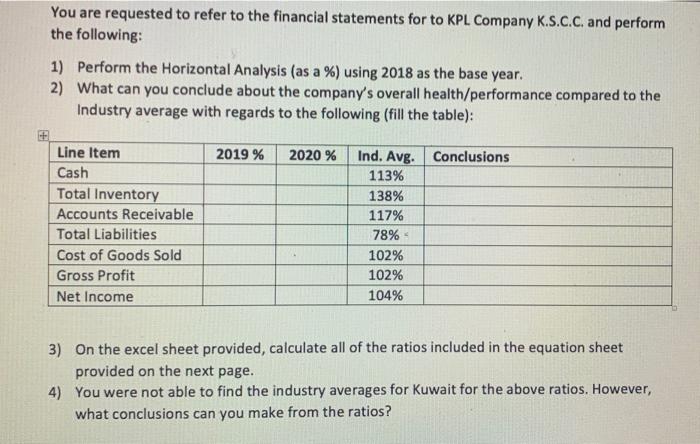
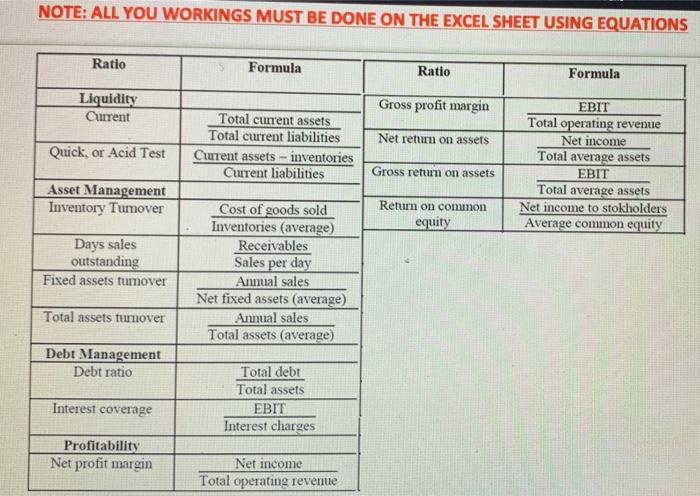
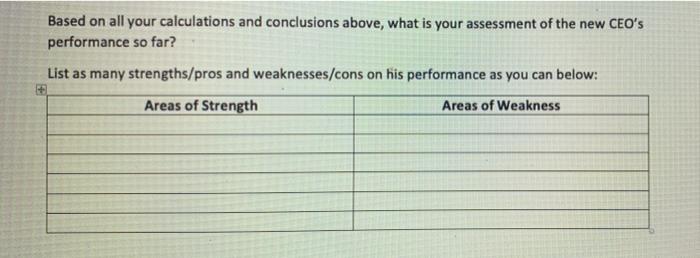
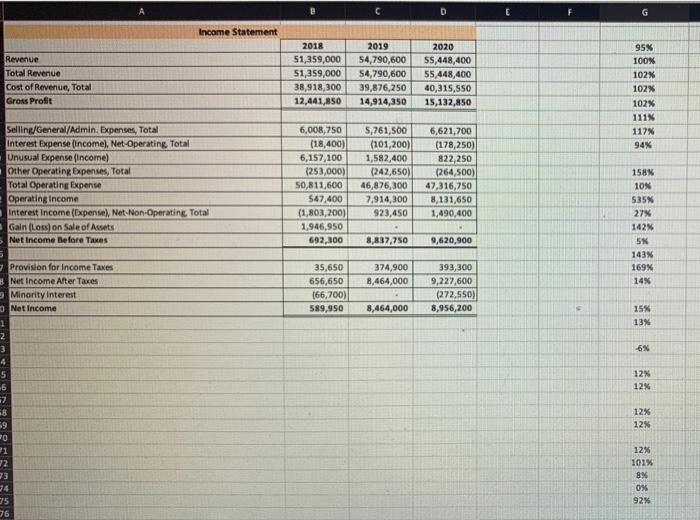
1 KPL Company K.S.C.P. All Amounts In KWD Balance Sheet 2018 2019 2020 Horrontal Analysis Industry Average 113 106% 117 138 4 Assets is Cash 6 Short Term Investments 7 Accounts Receivable 8 Total Inventory 9 Prepaid Expenses 10 Total Current Assets 11 Property/Plant/Equipment - Total - Gross 12 Accumulated Depreciation - Total 13 Property/Plant/Equipment - Total - Net 14 Long Term Investments 15 Total Assets 2.768 550 5,294,600 20,595.350 19,683,400 931,500 41.953 150 118,206,200 (83.993,700 34,211,350 46,921,150 123,086,800 BIN 9,685,300 7,031,100 20,399,850 1,838,150 568,100 48,171,200 120.065.750 (879462501 32, 124,100 47,296,050 127,590,200 4.365.400 10 565,050 25,847400 21,476,250 633,650 51.239.400 121.280,150 190, 151,950) 31,128,200 48,458,700 11N 89% 87% BX 95 130,826,300 SSN 16 8.415, 700 691 115.550 1644,500 723,350 24X 72 4,692,000 306% 15.293,850 99% 100% 1.699.900 5,800,600 3.521.300 21 564 800 1.443.000 14.000 7,987,900 3.207,350 5,925,950 30.6.100 17 Liabilities 18 Accounts Payable 19 Accrued Expenses 20 Notes Payable/Short Term Debt 21 Other Current liabilities - Total 22 Total Current Liabilities 23 Long Term Debt 24 Total Long Term Debt 25 Total Debt 26 Minority interest 27 Other Llabilities - Total 28 Total Liabilities 29 30 Shareholders Equity 31 Common Stock - Total 32 Additional Pald-in Capital 33 Retained Earnings (Accumulated Delicit) 34 Treasury Stock Common 35 Unrealized Gain (onal 36 Other Equity - Total 37 Total Equity 9,367.900 1848. OSO 731.400 2534 650 14.587.000 1521.30 1.521 130 731.400 6.471 050 6,485,300 27,541,350 100 10% 1583,800 1588 800 841.800 2.280.950 6.268,650 24,548,450 157X 109% 18 100 100% 43% 15 39.84.650 36.295.400 5.951.250 16.900 9.801700 140.250 52.700 39,877,400 36.824150 14.567.050 16.300) 11.443.650 41.400 102.746,750 40 013 100 37031.450 16.990.100 (39.100) 9.087.300 201250 103,286, 100 ESGX 496 103N 38 GO Income Statement 2018 2019 2020 95% LOON 102% 42 Revenue 4 Total Revenue 46 Cost of Revenue, Total 43 Gros Profit 51.359,000 51,399,000 38,918,300 12.441,850 54,790,600 54,790,600 39,676,250 14.914,350 55,448,400 55,448,400 40,315,350 15,13 RSO 102% 102N 56 SIN 119 34 5,761,500 (101.2001 1,582.400 (242,650) 46.876,300 7914,300 6,008,750 (18,4001 6,157.100 (253,0001 50,811,600 547,400 (1,801,200) 1.946,950 692,100 6,621,700 (178,250) 822,250 (264,500) 47.316.750 8.131.650 1.490.400 1589 10% 47 Selling/General/Admin Expenses, Total 48 Interest Expense (Incomel, Net-Operating. Total 49 Unusual Experie (income) 50 Other Operating Frentes. Total 51 Total Operating Expense 52 Operating Income 53 Interest Income (Expensel. Net Non-Operating Total 54 Gain (Loss) on Sale of Assets 55 Net Income Before Taxes 56 57 Provision for Income Taxes 58 Net Income After Taxes 59 Minority Interest 60 Net Income 923,450 SISX 27% 1425 8,837,750 9,520,900 5% 13 169 374.900 8,464.000 14 35,650 656 650 (66,700) 589,950 393,300 9,227,600 (272.550) 8,956,200 8,454,000 15X 3 KPL Company is a Kuwaiti publidy traded company established in 1997 (however, the founding family still owns about 70% of the shares). It operates in the food and beverage industry. It started off as a small company importing higher end water brands and a few meat products, which they then sold to hotels, restaurants, and coffee shops. Since then, they expanded their operations and are now the exclusive licensed distributer of over 30 exclusive brands of high end beverages (including from water, juices, and carbonated drink)s, as well as an extensive range of meat, dairy, and cooking ingredients products (beef, lamb, fish, chicken, dairy products, oils, herbs/spices, etc.) The founder has decided to step down from the CEO position in 2015 and assigned his son to the role. The founder is now the Chairman of the Board of Directors and wants the CEO evaluate the performance of his son over the past 3 years. The CEO has called you, as the Chief Financial Officer, to perform a financial statement analysis for him to review before presenting it to the Board. You are requested to refer to the financial statements for to KPL Company K.S.C.C. and perform the following: 1) Perform the Horizontal Analysis (as a %) using 2018 as the base year. 2) What can you conclude about the company's overall health/performance compared to the Industry average with regards to the following (fill the table): 2019 % Line Item 2020 % Conclusions Ind. Avg. 113% 138% 117% Cash Total Inventory Accounts Receivable Total Liabilities Cost of Goods Sold Gross Profit 78% 102% 10296 104% Net Income 3) On the excel sheet provided, calculate all of the ratios included in the equation sheet provided on the next page. 4) You were not able to find the industry averages for Kuwait for the above ratios. However, what conclusions can you make from the ratios? NOTE: ALL YOU WORKINGS MUST BE DONE ON THE EXCEL SHEET USING EQUATIONS Ratio Formula Ratio Formula Liquidity Current Gross profit margin Total current assets Total current liabilities Curent assets - inventories Curent liabilities Net return on assets EBIT Total operating revenue Net income Total average assets Quick, or Acid Test Gross retum on assets EBIT Asset Management Inventory Tumover Return on common equity Total average assets Net income to stokholders Average common equity Days sales outstanding Fixed assets tumover Cost of goods sold Inventories (average) Receivables Sales per day Annual sales Net fixed assets (average) Annual sales Total assets (average) Total assets turnover Debt Management Debt ratio Total debt Total assets EBIT Interest charges Interest coverage Profitability Net profit margin Net income Total operating revenie 1 KPL Company K.S.C.P. All Amounts in KWD Balance Sheet 3 2018 2019 2020 Horizontal Analysis Industry Average 1135 106% 117% 138 818 3,768,550 5,294,600 20,595,350 19,683,400 931,500 41,953, 150 118,206,200 (83,993,700) 34,211,350 46,921,150 123,086,800 9,685,300 7,031,100 20,399,850 18,838,150 568, 100 48,171,200 120,065,750 (87,946,250) 32,124,100 47,296,050 127,590,200 4,365,400 10,565,050 25,847,400 21,476,250 633,650 51,239,400 121,280,150 190,151,950) 31,128,200 48,458,700 130,826,300 113% 89N 88N 95% 95% 8,415,700 9,367,900 69% 1,639,900 1,848,050 243% 4 Assets 5 Cash 6 Short Term Investments 7 Accounts Receivable 8 Total Inventory 9 Prepaid Expenses 10 Total Current Assets 11 Property/Plant/Equipment. Total Gross 12 Accumulated Depreciation - Total 13 Property/Plant/Equipment - Total-Net 14 Long Term Investments 15 Total Assets 16 17 Llabilities 18 Accounts Payable 19 Accrued Expenses 20 Notes Payable/Short Term Debt 21 Other Current liabilities. Total 22 Total Current Liabilities 23 Long Term Debt 24 Total Long Term Debt 25 Total Debt 26 Minority interest 27 Other Liabilities Total 28 Total Liabilities 29 30 Shareholders Equity 31 Common Stock - Total 32 Additional Pald-In Capital 33 Retained Earnings (Accumulated Delicit) 34 Treasury Stack-Common 35 Unrealized Gain (Loss) 36 Other Equity - Total 37 Total Equity 5.800,600 731,400 77% 3,521,300 2,634,650 306% 14,582,000 99N 8,115,5SO 1,644,500 723,350 4,692,000 15,293,850 1.583,800 1.583,800 841,800 3,280,950 6,268,650 100% 21,564,800 1.443,000 1,443,000 7.987.900 3,207,350 5,925,950 100N 1.521,130 1,521,130 731,400 6,471,050 6,488,300 10% 152N 109 30,698,100 24,843,450 27,541,350 78% 39.277,400 40,013,100 100% 36,824,150 37,033,450 100% 43% 39,848,650 36,295,400 5.951,250 15,900) 9,841,700 140,250) 14,567,050 16,900) 19 16,990, 100 39,100) 9,087,300 201,250 11.443.650 856% 41,400 4% 92,388,700 102,746,750 103,286,100 103N 38 You are requested to refer to the financial statements for to KPL Company K.S.C.C. and perform the following: 1) Perform the Horizontal Analysis (as a %) using 2018 as the base year. 2) What can you conclude about the company's overall health/performance compared to the Industry average with regards to the following (fill the table): Line Item 2019 % 2020 % Conclusions Ind. Avg. 113% Cash 138% Total Inventory Accounts Receivable Total Liabilities 117% 78% 102% Cost of Goods Sold Gross Profit 102% Net Income 104% 3) On the excel sheet provided, calculate all of the ratios included in the equation sheet provided on the next page. 4) You were not able to find the industry averages for Kuwait for the above ratios. However, what conclusions can you make from the ratios? NOTE: ALL YOU WORKINGS MUST BE DONE ON THE EXCEL SHEET USING EQUATIONS Ratio Formula Ratio Formula Liquidity Current Gross profit margin Total current assets Total current liabilities Current assets - inventories Current liabilities Net return on assets Quick, or Acid Test Gross retuun on assets EBIT Total operating revenue Net income Total average assets EBIT Total average assets Net income to stokholders Average common equity Asset Management Inventory Tumover Return on common equity Days sales outstanding Fixed assets tumover Cost of goods sold Inventories (average) Receivables Sales per day Annual sales Net fixed assets (average) Annual sales Total assets (average) Total assets turnover Debt Management Debt ratio Interest coverage Total debt Total assets EBIT Interest charges Profitability Net profit margin Net income Total operating revenue Based on all your calculations and conclusions above, what is your assessment of the new CEO's performance so far? List as many strengths/pros and weaknesses/cons on his performance as you can below: Areas of Strength Areas of Weakness D Income Statement 2018 2019 2020 95% 51,359,000 55,448,400 100N Revenue Total Revenue Cost of Revenue, Total Gross Profit 102% 54,790,600 54,790,600 39,876,250 51,359,000 38,918,300 55,448,400 40,315,550 15,132,850 102% 12,441,850 14,914,350 102% 111 117% 94% Selling/General/Admin. Expenses, Total Interest Expense (income). Net Operating Total Unusual Expense (income) Other Operating Expenses, Total Total Operating Expense Operating income Interest Income (Expense, Net-Non-Operating Total Gain (Loss) on Sale of Assets Net Income Before Taxes 6,008,750 (18,400) 6,157,100 (253,000) 50,811,600 547,400 (1,803,200) 1,946,950 5,761,500 (101,200) 1,582,400 (242,650) 46,876,300 7,914,300 923,450 158% 6,621,700 (178,250) 822,250 (264,500) 47,316,750 8,131,650 1,490,400 10% 535 27% 142% 692,300 8,837,750 9,620,900 5% 143N 35,650 169% 374,900 8,464,000 14 Provision for Income Taxes Net Income After Taxes Minority interest o Net Income 656,650 (66,700) 589,950 393,300 9,227,600 (272,550) 8,956,200 8,464,000 15% 1 13% 2 3 -6% 4 5 12% -6 12% 2 8 12% 59 12% 70 1 12% 101% 8% 23 J 24 0% 35 92% 76