

Question
1. Let denote the usual parameter of the Poisson distribution. The approximate sampling distribution of ^MLE, as estimated using the available =52n=52data values representing the
1.
Let denote the usual parameter of the Poisson distribution.
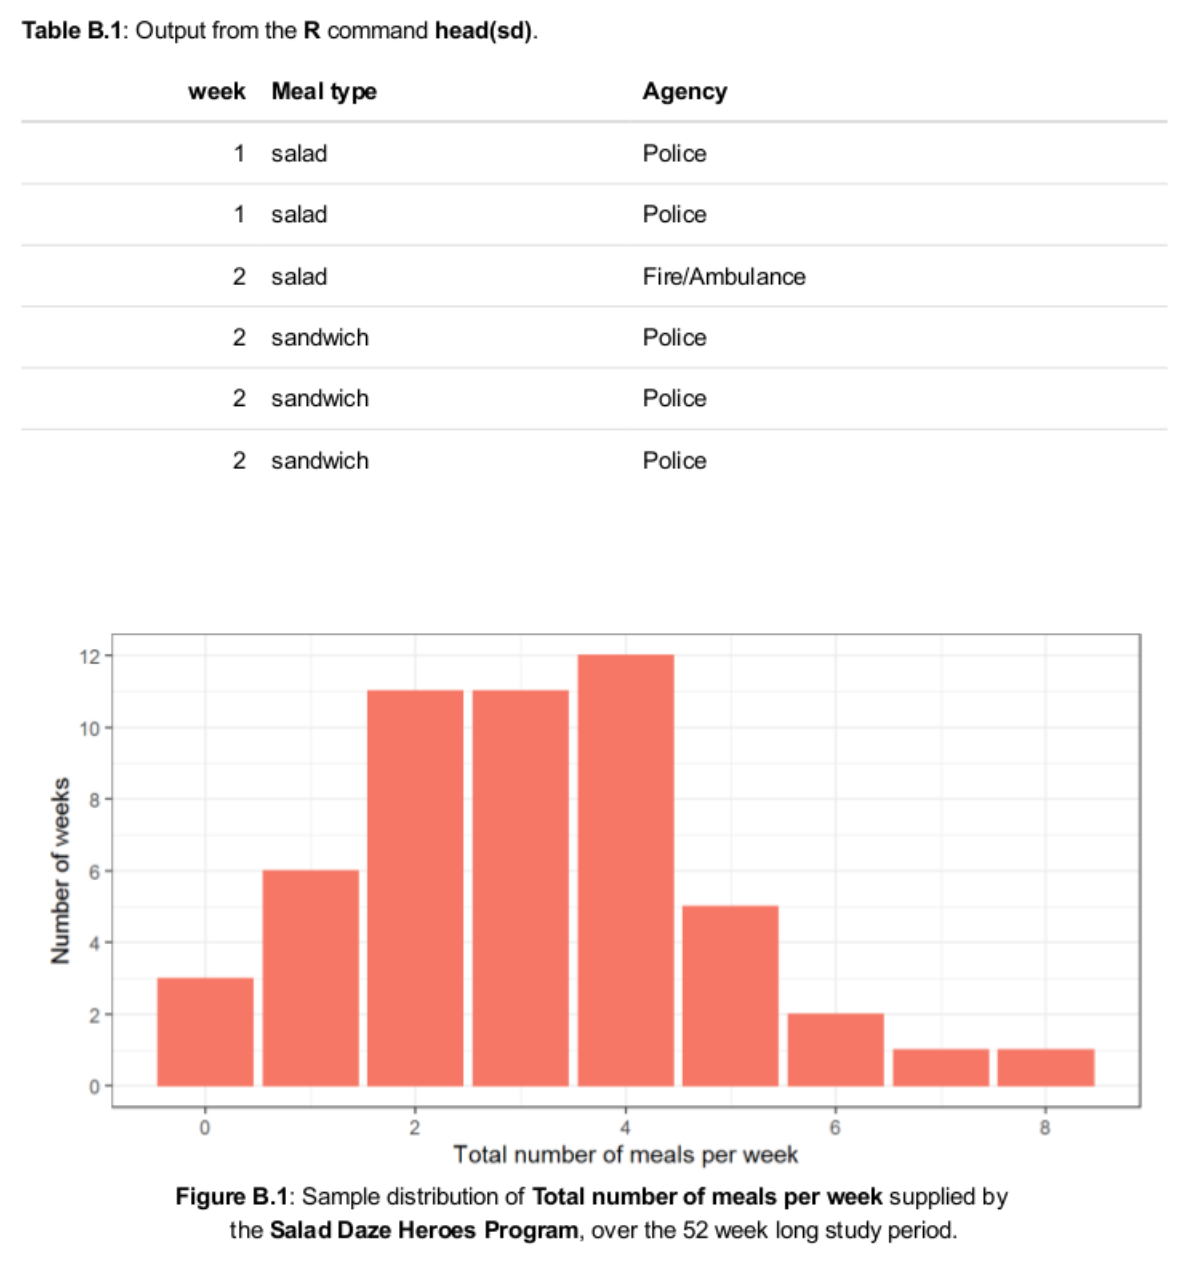
The approximate sampling distribution of ^MLE, as estimated using the available =52n=52data values representing theTotal number of meals per weeksupplied by theHeroes Program, is a Normal distribution, with mean equal to 2.982 and variance equal to (0.2352)/161.
T/F
2.
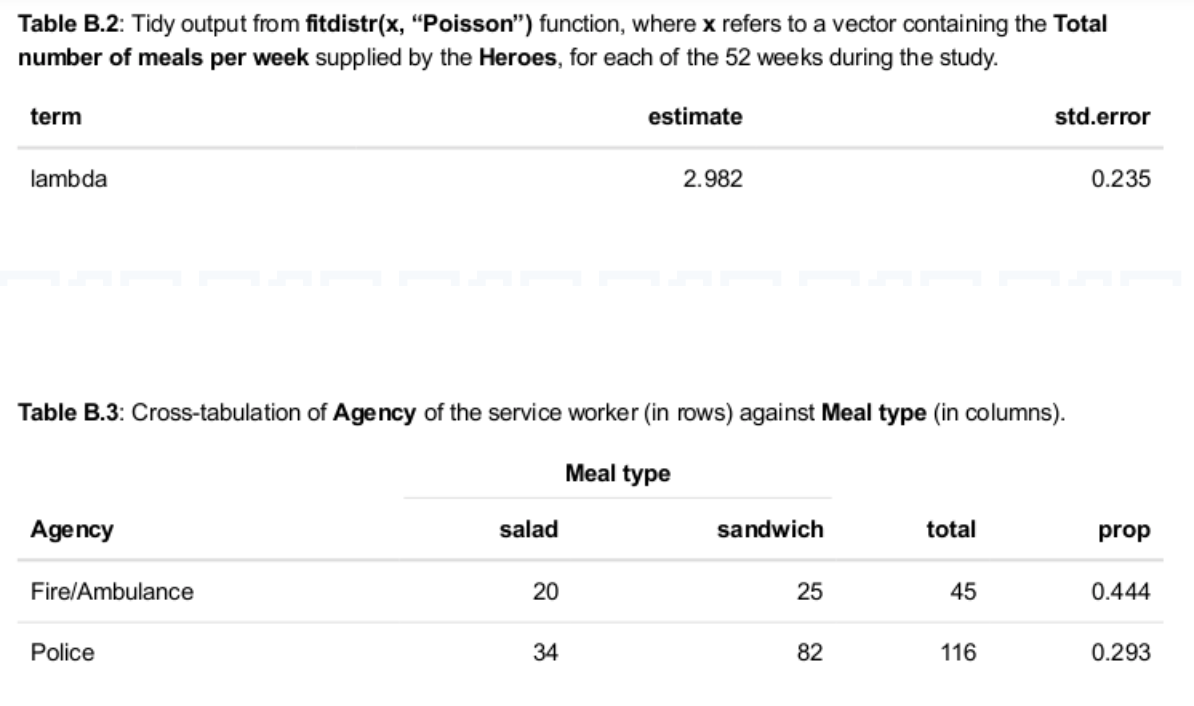
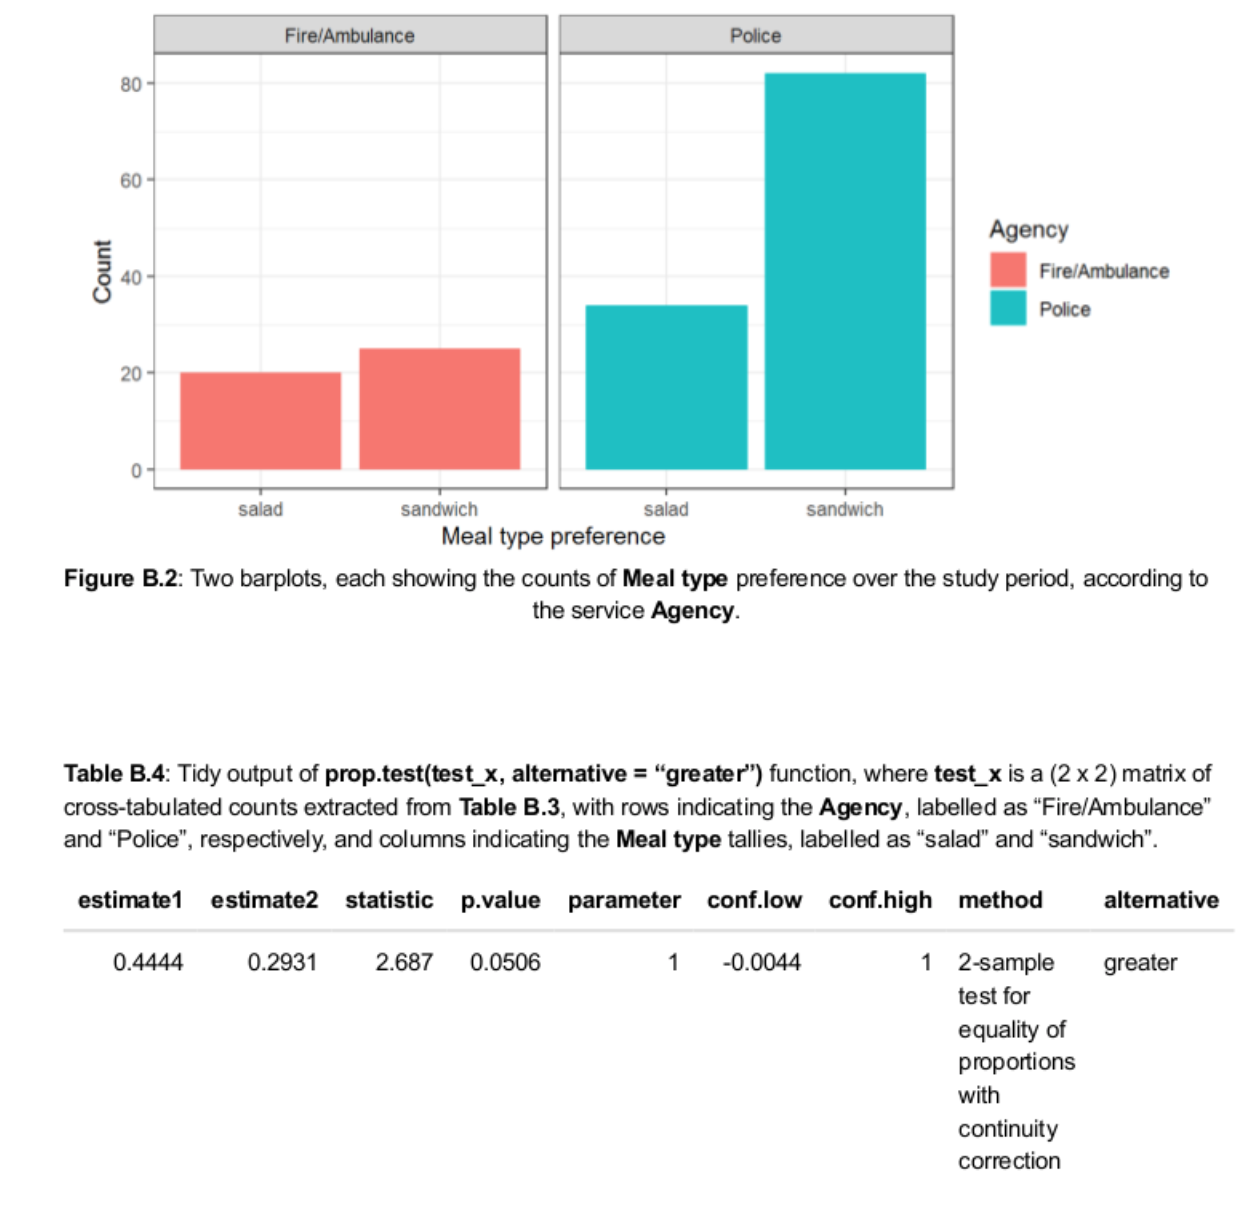
The output from theprop.test()function shown inTable B.4indicates that Fire/Ambulance service workers are more likely to choose a salad (instead of a sandwich) than are Police service workers.
T/F
3.
Which of the following statements isTRUE?
Select one:
a. The MLE-based forecast distribution for theTotal number of meals per weekprovided by theHeroesprogram, corresponding to the first week after the end of the sample period is a (=2.982)Poisson(=2.982) distribution.
b. When evaluated at the Maximum Likelihood Estimator, ^MLE, the log-Likelihood function has the same value as the Likelihood function.
c. The application of theprop.test()function, resulting in the output reported inTable B.4, is based on a regression model where the dependent variable is theTotal number of salad meals, and the independent variable is theTotal number of sandwich meals.
d. A Bootstrap-based confidence interval could be constructed for/pF/ApP.
6.
Again consider using a()
distribution to model the available=52
observations representing theTotal number of meals per weeksupplied to emergency service workers by theHeroes Program.Sally advises that before she started theHeroes Program, she expected to serve about 5 meals per week, on average. She also had anticipated that this average number of lunches per week could be different than five, but felt that there was a 90% chance that the average number of meals would be between one and eight.You therefore suggest to Sally that she adopt a Gamma distribution withshapeparameter=5
andrateparameter=1
, as this distribution is consistent with her stated prior belief. Sally is very happy to know this! And asks you to determine the posterior distribution for
now that the data has been collected.
Report the specific form of Sally's posterior distribution, and provide a justification for your answer.
[Note: You arenotrequired to formally derive the general form of the posterior distribution, rather you will need to identify the specific form of this distribution.]
Given the posterior distribution of
as detailed in Question 13, what is theBayes estimatorof
under the squared error loss function? Explain how to calculate its value in this context.
Step by Step Solution
There are 3 Steps involved in it
Step: 1

Get Instant Access to Expert-Tailored Solutions
See step-by-step solutions with expert insights and AI powered tools for academic success
Step: 2

Step: 3
Ace Your Homework with AI
Get the answers you need in no time with our AI-driven, step-by-step assistance
Get Started
Mathematical Applications for the Management Life and Social Sciences
Authors: Ronald J. Harshbarger, James J. Reynolds
11th edition
9781337032247, 9781305465183, 1305108043, 1337032247, 1305465180, 978-1305108042