1. Let X - Poi(1) with A=20. Hint: You may use EX = 1, Var(X)=1, and My()=el(6-D). 1 a. Use a Chernoff bound to obtain
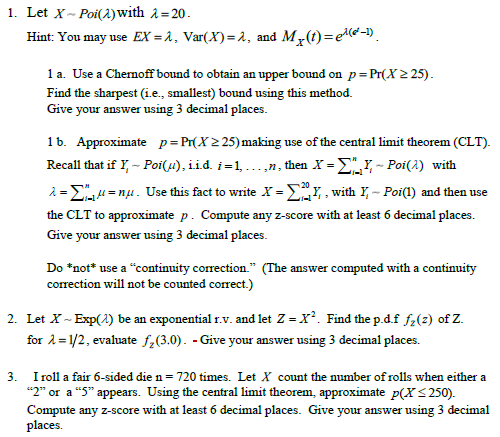
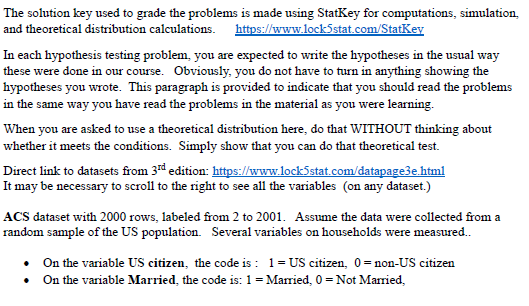
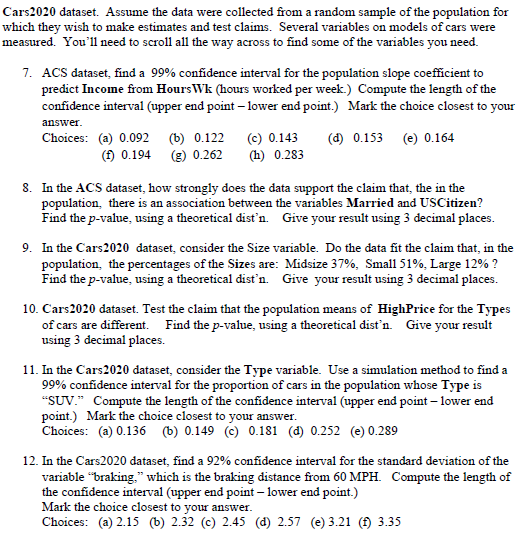
1. Let X - Poi(1) with A=20. Hint: You may use EX = 1, Var(X)=1, and My()=el(6-D). 1 a. Use a Chernoff bound to obtain an upper bound on p = Pr(X 2 25). Find the sharpest (i.e., smallest) bound using this method. Give your answer using 3 decimal places. 1 b. Approximate p=Pr(X 2 25) making use of the central limit theorem (CLT). Recall that if Y - Poi(#), i.id. 1=1, ...,m, then X" = > Y - Poi(1) with A=)_=nu. Use this fact to write X" = ) _Y , with Y - Poi(1) and then use the CLT to approximate p. Compute any z-score with at least 6 decimal places. Give your answer using 3 decimal places. Do *not* use a "continuity correction." (The answer computed with a continuity correction will not be counted correct.) 2. Let X - Exp(1) be an exponential r.v. and let Z = X". Find the p.d.f fz(2) of Z. for 1 =1/2, evaluate f,(3.0). - Give your answer using 3 decimal places. 3. I roll a fair 6-sided die n = 720 times. Let \\" count the number of rolls when either a "2" or a "5" appears. Using the central limit theorem, approximate p(X - 250). Compute any z-score with at least 6 decimal places. Give your answer using 3 decimal places.The solution key used to grade the problems is made using Statkey for computations, simulation, and theoretical distribution calculations. https://www.lock5stat.com/StatKey In each hypothesis testing problem, you are expected to write the hypotheses in the usual way these were done in our course. Obviously, you do not have to turn in anything showing the hypotheses you wrote. This paragraph is provided to indicate that you should read the problems in the same way you have read the problems in the material as you were learning. When you are asked to use a theoretical distribution here, do that WITHOUT thinking about whether it meets the conditions. Simply show that you can do that theoretical test. Direct link to datasets from 3" edition: https://www.lockSstat.com/datapage3e.html It may be necessary to scroll to the right to see all the variables (on any dataset.) ACS dataset with 2000 rows, labeled from 2 to 2001. Assume the data were collected from a random sample of the US population. Several variables on households were measured.. On the variable US citizen, the code is : 1 = US citizen, 0 = non-US citizen . On the variable Married, the code is: 1 = Married, 0 = Not Married,Cars2020 dataset. Assume the data were collected from a random sample of the population for which they wish to make estimates and test claims. Several variables on models of cars were measured. You'll need to scroll all the way across to find some of the variables you need. 7. ACS dataset, find a 99% confidence interval for the population slope coefficient to predict Income from Hours Wk (hours worked per week.) Compute the length of the confidence interval (upper end point - lower end point.) Mark the choice closest to your answer. Choices: (a) 0.092 (b) 0.122 (c) 0.143 (d) 0.153 (e) 0.164 (f) 0.194 (g) 0.262 (h) 0.283 8. In the ACS dataset, how strongly does the data support the claim that, the in the population, there is an association between the variables Married and USCitizen? Find the p-value, using a theoretical dist'n. Give your result using 3 decimal places. 9. In the Cars2020 dataset, consider the Size variable. Do the data fit the claim that, in the population, the percentages of the Sizes are: Midsize 37%, Small 51%, Large 12% ? Find the p-value, using a theoretical dist'n. Give your result using 3 decimal places. 10. Cars2020 dataset. Test the claim that the population means of HighPrice for the Types of cars are different. Find the p-value, using a theoretical dist'n. Give your result using 3 decimal places. 11. In the Cars2020 dataset, consider the Type variable. Use a simulation method to find a 99% confidence interval for the proportion of cars in the population whose Type is "SUV." Compute the length of the confidence interval (upper end point - lower end point.) Mark the choice closest to your answer. Choices: (a) 0.136 (b) 0.149 (c) 0.181 (d) 0.252 (e) 0.289 12. In the Cars2020 dataset, find a 92% confidence interval for the standard deviation of the variable "braking," which is the braking distance from 60 MPH. Compute the length of the confidence interval (upper end point - lower end point.) Mark the choice closest to your answer. Choices: (a) 2.15 (b) 2.32 (c) 2.45 (d) 2.57 (e) 3.21 (f) 3.35
Step by Step Solution
There are 3 Steps involved in it
Step: 1
Get Instant Access to Expert-Tailored Solutions
See step-by-step solutions with expert insights and AI powered tools for academic success
Step: 2
Step: 3
Ace Your Homework with AI
Get the answers you need in no time with our AI-driven, step-by-step assistance