Answered step by step
Verified Expert Solution
Link Copied!

Question

1 Approved Answer

1. Load the Uber dataset using pd.read_csv and save it into the uber_data variable. A. Perform the following functions on my_data 1. Generate the output
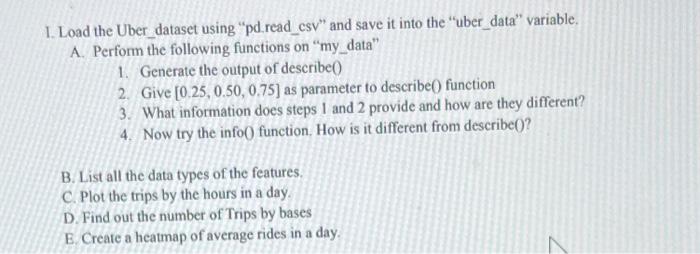
image text in transcribed
1. Load the Uber dataset using "pd.read_csv" and save it into the "uber_data" variable. A. Perform the following functions on "my_data" 1. Generate the output of describe 0 2. Give [0.25,0.50,0.75] as parameter to describe 0 function 3. What information does steps 1 and 2 provide and how are they different? 4. Now try the info0 function. How is it different from describe0? B. List all the data types of the features. C. Plot the trips by the hours in a day. D. Find out the number of Trips by bases E. Create a heatmap of average rides in a day

Step by Step Solution

There are 3 Steps involved in it

Step: 1

blur-text-image

Get Instant Access to Expert-Tailored Solutions

See step-by-step solutions with expert insights and AI powered tools for academic success

Step: 2

blur-text-image

Step: 3

blur-text-image

Ace Your Homework with AI

Get the answers you need in no time with our AI-driven, step-by-step assistance

Get Started

Recommended Textbook for

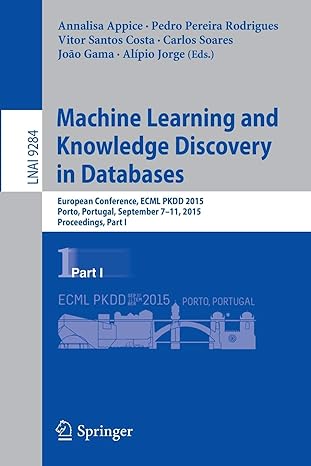
Machine Learning And Knowledge Discovery In Databases European Conference Ecml Pkdd 2015 Porto Portugal September 7 11 2015 Proceedings Part 1 Lnai 9284

Authors: Annalisa Appice ,Pedro Pereira Rodrigues ,Vitor Santos Costa ,Carlos Soares ,Joao Gama ,Alipio Jorge

1st Edition

3319235273, 978-3319235271

More Books

Students also viewed these Databases questions

Question

=+52-2 Contrast parental and peer influences during adolescence.

Answered: 1 week ago