Answered step by step
Verified Expert Solution
Question
1 Approved Answer
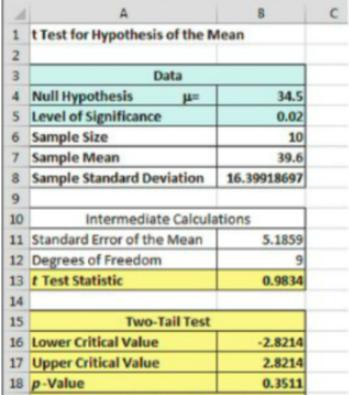
1. Look at the following phStat output for hypothesis test. What is the conclusion for this t-test for the hypothesis of the mean (sigma


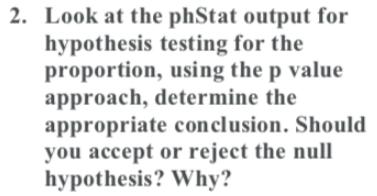
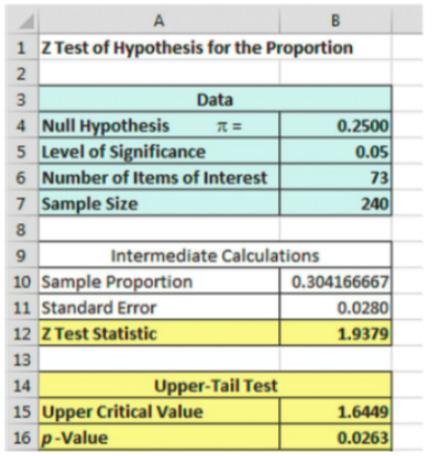
1. Look at the following phStat output for hypothesis test. What is the conclusion for this t-test for the hypothesis of the mean (sigma unknown)? Should you accept or reject the null hypothesis? Why? 1 tTest for Hypothesis of the Mean 3. Data 4 Null Hypothesis 5 Level of Significance 6 Sample Size 7 Sample Mean 8 Sample Standard Deviation 34.5 0.02 10 39.6 16.39918697 Intermediate Calculations 10 11 Standard Error of the Mean 12 Degrees of Freedom 13 t Test Statistic 5.1859 0.9834 14 15 Two-Tail Test -2.8214 2.8214 Lower Critical Value 16 17 Upper Critical Value 18 p-Value 0.3511 2. Look at the phStat output for hypothesis testing for the proportion, using the p value approach, determine the appropriate conclusion. Should you accept or reject the null hypothesis? Why? A 1 Z Test of Hypothesis for the Proportion 2 Data 4 Null Hypothesis 5 Level of Significance 0.2500 0.05 73 Number of Items of Interest 6 240 7 Sample Size Intermediate Calculations 0.304166667 0.0280 1.9379 10 Sample Proportion 11 Standard Error 12 Z Test Statistic 13 14 Upper-Tail Test 1.6449 0.0263 15 Upper Critical Value 16 p-Value 3. Type II error is known as the consumer's risk because, when it occurs in quality control settings, the customer is getting a product from a process that is not performing properly. Is this a true or false statement? Explain.
Step by Step Solution
★★★★★
3.28 Rating (154 Votes )
There are 3 Steps involved in it
Step: 1

Get Instant Access to Expert-Tailored Solutions
See step-by-step solutions with expert insights and AI powered tools for academic success
Step: 2

Step: 3

Ace Your Homework with AI
Get the answers you need in no time with our AI-driven, step-by-step assistance
Get Started


