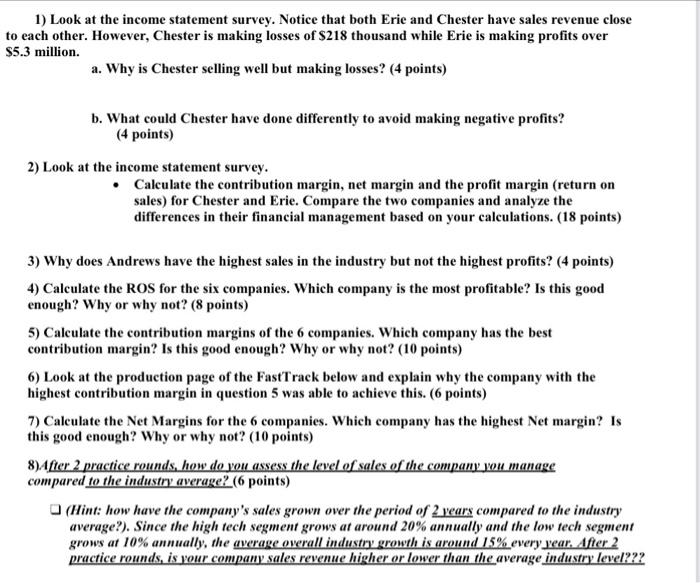
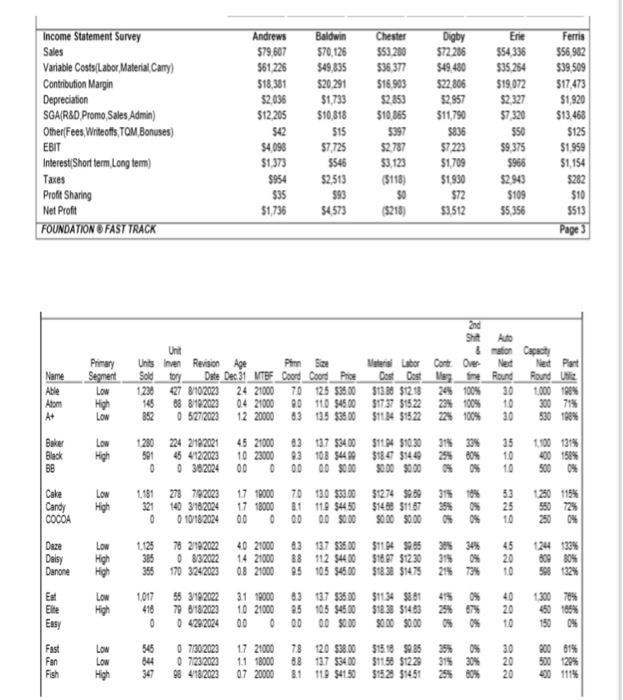
1) Look at the income statement survey. Notice that both Erie and Chester have sales revenue close to each other. However, Chester is making losses of $218 thousand while Erie is making profits over $5.3 million. a. Why is Chester selling well but making losses? (4 points) b. What could Chester have done differently to avoid making negative profits? (4 points) 2) Look at the income statement survey. Calculate the contribution margin, net margin and the profit margin (return on sales) for Chester and Erie. Compare the two companies and analyze the differences in their financial management based on your calculations. (18 points) 3) Why does Andrews have the highest sales in the industry but not the highest profits? (4 points) 4) Calculate the ROS for the six companies. Which company is the most profitable? Is this good enough? Why or why not? (8 points) 5) Calculate the contribution margins of the 6 companies. Which company has the best contribution margin? Is this good enough? Why or why not? (10 points) 6) Look at the production page of the FastTrack below and explain why the company with the highest contribution margin in question 5 was able to achieve this. (6 points) 7) Calculate the Net Margins for the 6 companies. Which company has the highest Net margin? Is this good enough? Why or why not? (10 points) 8)After 2 practice rounds, how do you assess the level of sales of the company you manage compared to the industry average? (6 points) (Hint: how have the company's sales grown over the period of 2 years compared to the industry average?). Since the high tech segment grows at around 20% annually and the low tech segment grows at 10% annually, the average overall industry growth is around 15% every year. After 2 practice rounds, is your company sales revenue higher or lower than the average industry level??? Income Statement Survey Sales Variable Costs/Labor Material Cany) Contribution Margin Depreciation SGA/R&D Promo, Sales Admin) Other Fees Writeofis, TOM Bonuses) EBIT Interest(Short term Long term) Taxes Proft Sharing Net Profit FOUNDATION FAST TRACK Andrews $79,607 $61.226 $18.381 $2.036 $12.205 542 $4,098 $1,373 $954 $35 $1,736 Baldwin 570,126 549835 $20.291 $1,733 $10,818 515 57,725 $546 $2,513 993 54573 Chester 553 280 $36 377 $16.903 $2853 $10.365 5397 $2.787 53,123 (5118) $0 Digby $72.286 $49,480 $22.806 52.957 $11,790 5836 57 223 $1,709 $1.930 $72 $3,512 Ere 554 336 $35 264 $19.072 $2.327 $7320 $50 59.375 $968 52.943 $109 $5.356 Ferris 556982 $39509 317,473 $1.920 $13.468 $125 $1.959 $1,154 5282 $10 $513 Page 3 Unt Name Able Atom A+ Primary Segment Low High LON 2nd She Auto &mation Capachy Units Inven Revision Age Pienso isteri Labor Cort Over Next Next Part Sold ty Date Dec 31 MTBF Coord CoordPre Dos_Dos_Meyfine Round Round Ulic 1230 127 8102020 24 21000 70 125 $35.00 $1330 $1298 34 100% 30 1000 1984 145 88 8192023 04 21000 90 110 $4500 $1737 $1522 23% 100% 300 71% 852 05272023 12 20000 63 135 $350 $11.34 $1522 22% 100% 30 530 790% Low Baker Black BB 1280 501 1100 131% High 224 2192021 45 4122023 0382004 45 21000 10 23000 00 0 83 93 00 187 $3400 10B 54499 00 $0.00 $11.04 $10.30 $18.47 $14 50.00 50.00 311 339 256 80% 0% 35 10 10 500 0% Cake Candy COCOA Low High 1.181 273 792023 17 10000 321 140 3182024 17 18000 0010182034 00 0 70 130 380.00 81 110 $4450 00 $0.00 51274 089 $14.90 31187 50.00 50.00 315 18% 53 25% 0% 25 10 1250 1154 550 72% 0% Daze Daisy Danone Low High High 1.125 78 2/192022 3860832022 355 170 3242023 40 21000 14 21000 08 21000 83 137 535.00 88 112 54400 95 105 $45.00 $11.94 $986 $16.97 $1230 $18.38 $14.75 384 34% 45 3150% 20 215 73% 10 1244 130% 50980% 588 1324 Ext Elte LOW High 1.017 55 3192022 418 79 6182023 0 0 429/2024 31 10000 10 21000 00 0 83 25 00 137 $350 105 $45.00 00 $0.00 $1134 5861 $1838 $14.50 $0.00 $0.00 0% 25% 67% 40 20 10 1300 78% 450 185% 150 0% Easy Fast Fan Fish LON LON High 545 844 347 0 7302023 07232023 98 4782023 17 21000 1.1 18000 07 20000 78 88 81 120 $38.00 137 $34.00 1 $4150 31518 5985 $1150 $1229 $1528 $1451 315 30% 30 20 20 900 81% 500 120% 490 1114