

Question
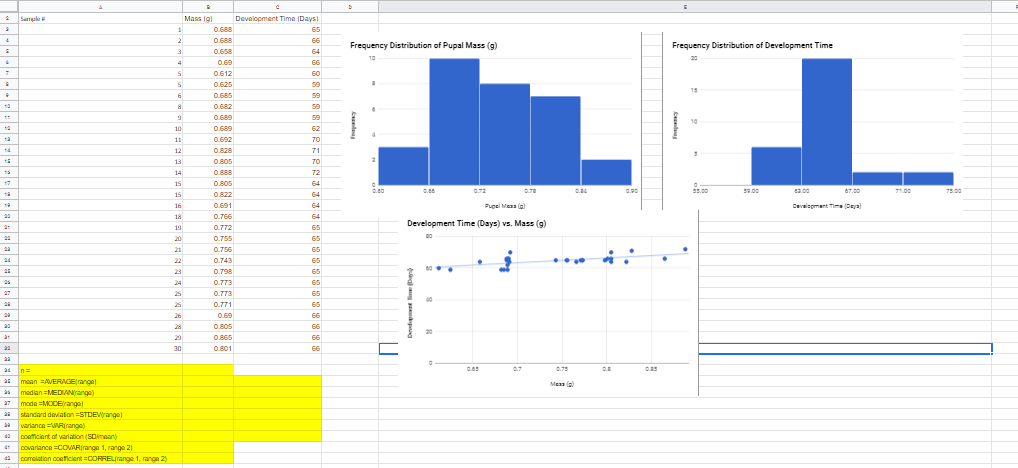
1) Looking at the graph on Frequency Distribution of Pupal Masses, what type of graph is it?(pie chart, column chart, bar chart, histogram, line graph,
1) Looking at the graph on Frequency Distribution of Pupal Masses, what type of graph is it?(pie chart, column chart, bar chart, histogram, line graph, scatter plot, area chart.)
2) What is the sample size? n =
3) Using the appropriate formula, calculatethe mean weight of pupal masses to 3 decimal places.=g
4)Using the appropriate formula, calculatethe median weight of pupal masses to 3 decimals. median =g
5)Using the appropriate formula, calculate the mode of the pupal mass weights to 3 decimals. mode=g
6)Using the appropriate formula, calculatethe standard deviation of pupal masses to 3 decimals.s=g
7)Using the appropriate formula, calculatethe variance of pupal masses to 3 decimals.s2=
8)Using the appropriate formula, calculatethe coefficient of variation of pupal masses to 3 decimals. CV =
9) Looking at the Frequency Distribution of Pupal Mass graph, the most frequent pupal mass range is fromto. Answer to 2 decimal places for each value.
10) Looking at the Frequency Distribution of Development Time graph,the most frequent development time range is fromto. Your answers should be 2 significant digits for each value.
11)Using the appropriate formula, calculatethe mean development time to 1 decimal.=days
12)Using the appropriate formula, calculatethe median development time to 1 decimal. median =days
13)Using the appropriate formula, calculatethe mode for development time. modedays
14)Using the appropriate formula, calculate the standard deviation for development time to 3 decimals.s =days
15)Using the appropriate formula, calculatethe variance for development time to 3 decimals.s2=
16)Using the appropriate formula, calculatethe coefficient of variation for development time to 3 decimals. CV =
17) Looking at the graph on Pupal Mass vs Development Time, what type of graph is this?(pie chart, column chart, bar chart, histogram, line graph, scatter plot, area chart.)
18)Using the appropriate formula, calculatethecovariance to 3 decimals. covariance =, now convert it to a percentage:%
19) Is the covariance positive, negative or zero?.
20) Are the variables dependent on one another?(yes, no)
21)Using the appropriate formula, calculatethe correlation coefficient to 3 decimals: r =
22) Is the correlation positive, negative or zero?
23) The null hypothesis was that development time has no effect on pupal mass. More stats need to be done, but based on the data collected so far, does it appear that they will reject the null? (yes or no)
24) Which program did you use for your calculations?(Excel or Sheets)
Step by Step Solution
There are 3 Steps involved in it
Step: 1

Get Instant Access to Expert-Tailored Solutions
See step-by-step solutions with expert insights and AI powered tools for academic success
Step: 2

Step: 3
Ace Your Homework with AI
Get the answers you need in no time with our AI-driven, step-by-step assistance
Get Started
Calculus Early Transcendentals
Authors: James Stewart
8th edition
1285741552, 9781305482463 , 978-1285741550