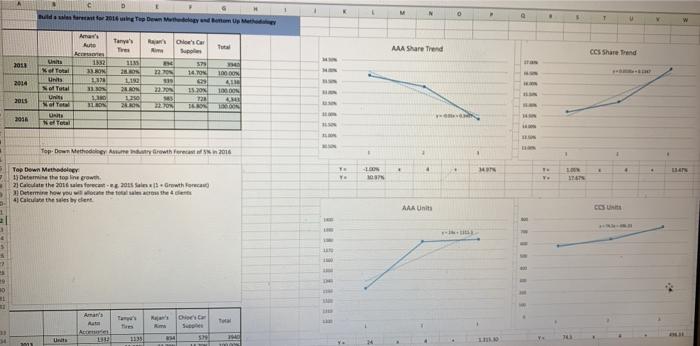
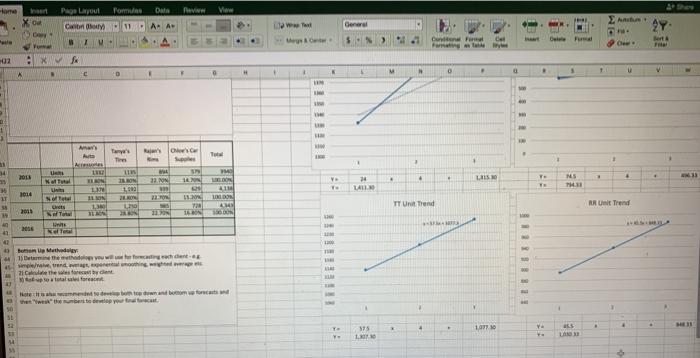
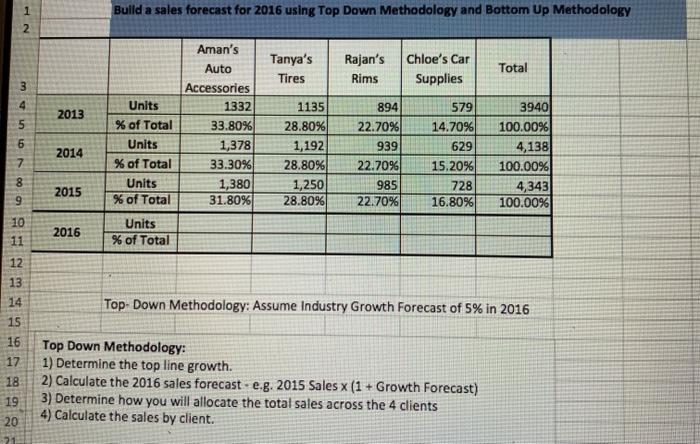
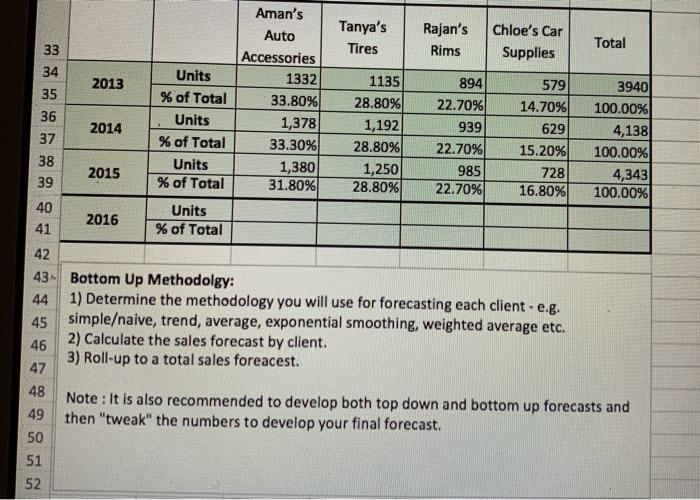
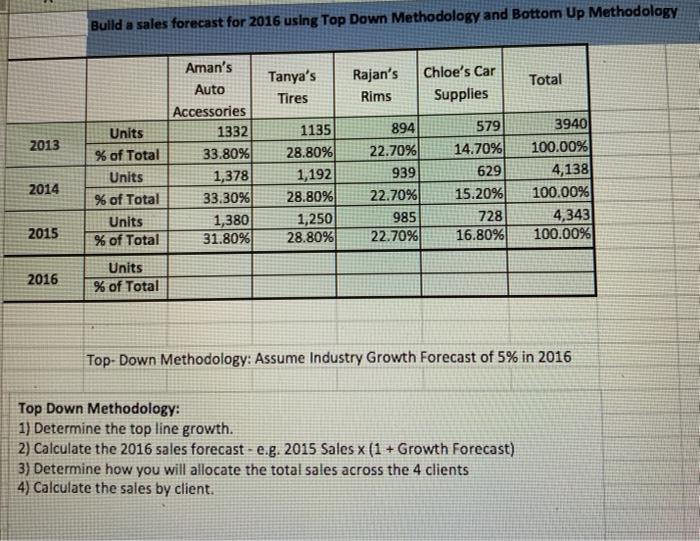
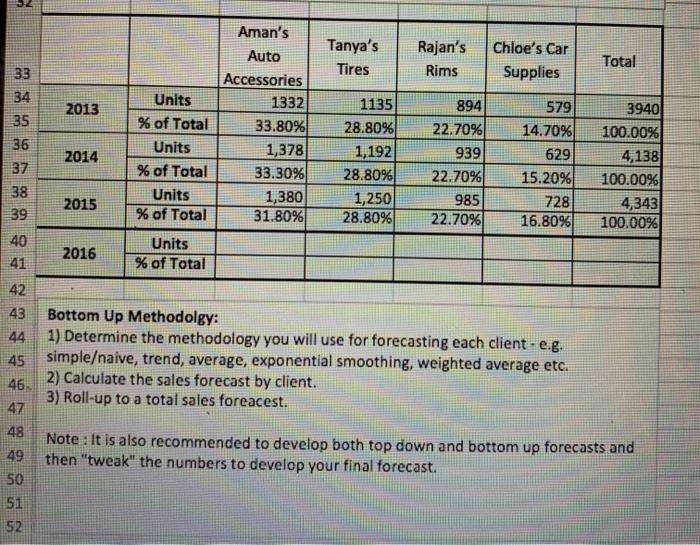
1 M 0 w Amer's kute Tany's R' im Total MAA Share Trend CCS Share Trend che Cay Supo 373 14.TW 2011 Units of Total UN 1332 13 ON 1120 220 2014 110 100 UN 4110 TOON 2 15.20 2015 11 Unit NG 30 BAN 20 TL 2011 Neto TopDown Methode Aur Browthreats 2016 1 + . . ve ITA Top Down Med 1) Determine the topline growth Calculate the 2016 forecast 2015 SelGrowth Face Determine how you call the othee Calculate sale by cene A Unit COUNT Aman's ON Se Aco 1911 Home Page Layout Form Dals Review Verw COM A A General m 1 Don F Yuna 02 c D + M Tany's Tres R's C. Auta . 14 2018 La Ye HEN MS ON 24 Natural 23. ON To 36 11 2014 08 11:30 Nofel 13 TT U Trend RR Unit Trend 44 DON 2015 ST 4 Bonn up Method 1) Deathed when trend washing 21 Cathew forecast by optowaluw Hoe med seboom wat whether you 50 52 575 100 085 15 1 Build a sales forecast for 2016 using Top Down Methodology and Bottom Up Methodology 2 Tanya's Tires Rajan's Rims Chloe's Car Supplies Total 4 2013 Aman's Auto Accessories 1332 33.80% 1,378 33.30% 1,380 31.80% 2014 Units % of Total Units % of Total Units % of Total 0 000 1135 28.80% 1,192 28.80% 1,250 28.80% 894 22.70% 939 22.7096 985 22.70% 579 14.70% 629 15.20% 728 16.80% 3940 100.00% 4,138 100.00% 4,343 100.00% 2015 10 11 2016 Units % of Total 12 13 14 Top-Down Methodology: Assume Industry Growth Forecast of 5% in 2016 15 16 17 18 Top Down Methodology: 1) Determine the top line growth. 2) Calculate the 2016 sales forecast - e.g. 2015 Sales x (1 + Growth Forecast) 3) Determine how you will allocate the total sales across the 4 clients 4) Calculate the sales by client. 19 20 21 Tanya's Tires Rajan's Rims Chloe's Car Supplies Total 2013 33 34 35 36 37 38 39 Aman's Auto Accessories Units 1332 % of Total 33.80% Units 1,378 % of Total 33.30% Units 1,380 % of Total 31.80% 2014 1135 28.80% 1,192 28.80% 1,250 28.80% 894 22.70% 939 22.70% 985 22.70% 579 14.70% 629 15.20% 728 16.80% 3940 100.00% 4,138 100.00% 4,343 100.00% 2015 40 41 2016 Units % of Total 42 43. Bottom Up Methodolgy: 44 1) Determine the methodology you will use for forecasting each client-e.g. 45 simpleaive, trend, average, exponential smoothing, weighted average etc. 2) Calculate the sales forecast by client. 46 3) Roll-up to a total sales foreacest. 47 48 Note: It is also recommended to develop both top down and bottom up forecasts and 49 then "tweak" the numbers to develop your final forecast. 50 51 52 Build a sales forecast for 2016 using Top Down Methodology and Bottom Up Methodology Tanya's Tires Rajan's Rims Chloe's Car Supplies Total 2013 Aman's Auto Accessories 1332 33.80% 1,378 33.30% 1,380 31.80% Units % of Total Units % of Total Units % of Total 1135 28.80% 1,192 28.80% 1,250 28.80% 2014 894 22.70% 939 22.70% 985 22.70% 579 14.70% 629 15.20% 728 16.80% 3940 100.00% 4,138 100.00% 4,343 100.00% 2015 2016 Units % of Total Top-Down Methodology: Assume Industry Growth Forecast of 5% in 2016 Top Down Methodology: 1) Determine the top line growth. 2) Calculate the 2016 sales forecast - e.g. 2015 Sales x (1 + Growth Forecast) 3) Determine how you will allocate the total sales across the 4 clients 4) Calculate the sales by client. 5. 2 Tanya's Tires Rajan's Rims Chloe's Car Supplies Total 33 34 2013 35 36 37 38 39 2014 Aman's Auto Accessories 1332 33.80% 1,378 33.30% 1,380 31.80% Units % of Total Units % of Total Units % of Total 1135 28.80% 1,192 28.80% 1,250 28.80% 894 22.70% 939 22.70% 985 22.70% 579 14.70% 629 15.20% 728 16.80% 3940 100.00% 4,138 100.00% 4,343 100.00% 2015 40 41 2016 Units % of Total 42 43 44 45 46. 47 48 Bottom Up Methodolgy: 1) Determine the methodology you will use for forecasting each client - e.g. simpleaive, trend, average, exponential smoothing, weighted average etc. 2) Calculate the sales forecast by client. 3) Roll-up to a total sales foreacest. 49 Note: It is also recommended to develop both top down and bottom up forecasts and then "tweak" the numbers to develop your final forecast. 50 51 52 1 M 0 w Amer's kute Tany's R' im Total MAA Share Trend CCS Share Trend che Cay Supo 373 14.TW 2011 Units of Total UN 1332 13 ON 1120 220 2014 110 100 UN 4110 TOON 2 15.20 2015 11 Unit NG 30 BAN 20 TL 2011 Neto TopDown Methode Aur Browthreats 2016 1 + . . ve ITA Top Down Med 1) Determine the topline growth Calculate the 2016 forecast 2015 SelGrowth Face Determine how you call the othee Calculate sale by cene A Unit COUNT Aman's ON Se Aco 1911 Home Page Layout Form Dals Review Verw COM A A General m 1 Don F Yuna 02 c D + M Tany's Tres R's C. Auta . 14 2018 La Ye HEN MS ON 24 Natural 23. ON To 36 11 2014 08 11:30 Nofel 13 TT U Trend RR Unit Trend 44 DON 2015 ST 4 Bonn up Method 1) Deathed when trend washing 21 Cathew forecast by optowaluw Hoe med seboom wat whether you 50 52 575 100 085 15 1 Build a sales forecast for 2016 using Top Down Methodology and Bottom Up Methodology 2 Tanya's Tires Rajan's Rims Chloe's Car Supplies Total 4 2013 Aman's Auto Accessories 1332 33.80% 1,378 33.30% 1,380 31.80% 2014 Units % of Total Units % of Total Units % of Total 0 000 1135 28.80% 1,192 28.80% 1,250 28.80% 894 22.70% 939 22.7096 985 22.70% 579 14.70% 629 15.20% 728 16.80% 3940 100.00% 4,138 100.00% 4,343 100.00% 2015 10 11 2016 Units % of Total 12 13 14 Top-Down Methodology: Assume Industry Growth Forecast of 5% in 2016 15 16 17 18 Top Down Methodology: 1) Determine the top line growth. 2) Calculate the 2016 sales forecast - e.g. 2015 Sales x (1 + Growth Forecast) 3) Determine how you will allocate the total sales across the 4 clients 4) Calculate the sales by client. 19 20 21 Tanya's Tires Rajan's Rims Chloe's Car Supplies Total 2013 33 34 35 36 37 38 39 Aman's Auto Accessories Units 1332 % of Total 33.80% Units 1,378 % of Total 33.30% Units 1,380 % of Total 31.80% 2014 1135 28.80% 1,192 28.80% 1,250 28.80% 894 22.70% 939 22.70% 985 22.70% 579 14.70% 629 15.20% 728 16.80% 3940 100.00% 4,138 100.00% 4,343 100.00% 2015 40 41 2016 Units % of Total 42 43. Bottom Up Methodolgy: 44 1) Determine the methodology you will use for forecasting each client-e.g. 45 simpleaive, trend, average, exponential smoothing, weighted average etc. 2) Calculate the sales forecast by client. 46 3) Roll-up to a total sales foreacest. 47 48 Note: It is also recommended to develop both top down and bottom up forecasts and 49 then "tweak" the numbers to develop your final forecast. 50 51 52 Build a sales forecast for 2016 using Top Down Methodology and Bottom Up Methodology Tanya's Tires Rajan's Rims Chloe's Car Supplies Total 2013 Aman's Auto Accessories 1332 33.80% 1,378 33.30% 1,380 31.80% Units % of Total Units % of Total Units % of Total 1135 28.80% 1,192 28.80% 1,250 28.80% 2014 894 22.70% 939 22.70% 985 22.70% 579 14.70% 629 15.20% 728 16.80% 3940 100.00% 4,138 100.00% 4,343 100.00% 2015 2016 Units % of Total Top-Down Methodology: Assume Industry Growth Forecast of 5% in 2016 Top Down Methodology: 1) Determine the top line growth. 2) Calculate the 2016 sales forecast - e.g. 2015 Sales x (1 + Growth Forecast) 3) Determine how you will allocate the total sales across the 4 clients 4) Calculate the sales by client. 5. 2 Tanya's Tires Rajan's Rims Chloe's Car Supplies Total 33 34 2013 35 36 37 38 39 2014 Aman's Auto Accessories 1332 33.80% 1,378 33.30% 1,380 31.80% Units % of Total Units % of Total Units % of Total 1135 28.80% 1,192 28.80% 1,250 28.80% 894 22.70% 939 22.70% 985 22.70% 579 14.70% 629 15.20% 728 16.80% 3940 100.00% 4,138 100.00% 4,343 100.00% 2015 40 41 2016 Units % of Total 42 43 44 45 46. 47 48 Bottom Up Methodolgy: 1) Determine the methodology you will use for forecasting each client - e.g. simpleaive, trend, average, exponential smoothing, weighted average etc. 2) Calculate the sales forecast by client. 3) Roll-up to a total sales foreacest. 49 Note: It is also recommended to develop both top down and bottom up forecasts and then "tweak" the numbers to develop your final forecast. 50 51 52
