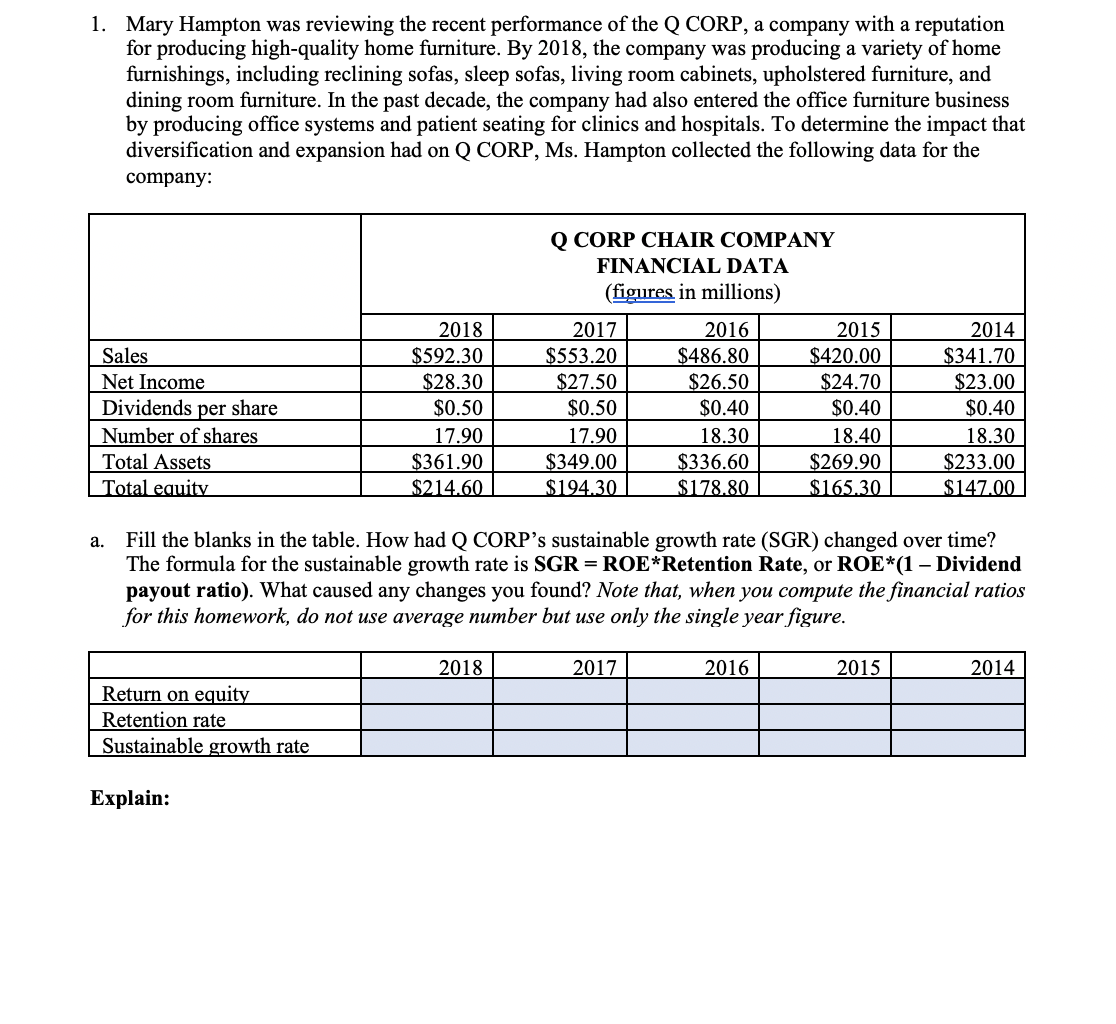

1. Mary Hampton was reviewing the recent performance of the Q CORP, a company with a reputation for producing high-quality home furniture. By 2018, the company was producing a variety of home furnishings, including reclining sofas, sleep sofas, living room cabinets, upholstered furniture, and dining room furniture. In the past decade, the company had also entered the office furniture business by producing office systems and patient seating for clinics and hospitals. To determine the impact that diversification and expansion had on Q CORP, Ms. Hampton collected the following data for the company: Q CORP CHAIR COMPANY FINANCIAL DATA (figures in millions) 2018 2017 2016 2015 2014 $341.70 Sales $592.30 $553.20 $486.80 $420.00 Net Income $28.30 $27.50 $26.50 $24.70 $23.00 Dividends per share $0.50 $0.50 $0.40 $0.40 $0.40 Number of shares 17.90 17.90 18.30 18.40 18.30 Total Assets $361.90 $349.00 $336.60 $269.90 $233.00 Total equity $214.60 $194.30 $178.80 $165.30 $147.00 a. Fill the blanks in the table. How had Q CORP's sustainable growth rate (SGR) changed over time? The formula for the sustainable growth rate is SGR = ROE*Retention Rate, or ROE*(1 - Dividend payout ratio). What caused any changes you found? Note that, when you compute the financial ratios for this homework, do not use average number but use only the single year figure. 2018 2017 2016 2015 2014 Return on equity Retention rate Sustainable growth rate Explain: b. The home furniture industry had the following ratios over the same time. How did Q CORP compare with the industry? Return on equity Retention rate Sustainable growth rate Explain: HOME FURNITURE INDUSTRY RATIOS 2017 15.54% 71.00% 11.03% 2018 15.12% 71.00% 10.73% 2016 15.31% 71.00% 10.87% 2015 15.74% 72.00% 11.33% 1. Mary Hampton was reviewing the recent performance of the Q CORP, a company with a reputation for producing high-quality home furniture. By 2018, the company was producing a variety of home furnishings, including reclining sofas, sleep sofas, living room cabinets, upholstered furniture, and dining room furniture. In the past decade, the company had also entered the office furniture business by producing office systems and patient seating for clinics and hospitals. To determine the impact that diversification and expansion had on Q CORP, Ms. Hampton collected the following data for the company: Q CORP CHAIR COMPANY FINANCIAL DATA (figures in millions) 2018 2017 2016 2015 2014 $341.70 Sales $592.30 $553.20 $486.80 $420.00 Net Income $28.30 $27.50 $26.50 $24.70 $23.00 Dividends per share $0.50 $0.50 $0.40 $0.40 $0.40 Number of shares 17.90 17.90 18.30 18.40 18.30 Total Assets $361.90 $349.00 $336.60 $269.90 $233.00 Total equity $214.60 $194.30 $178.80 $165.30 $147.00 a. Fill the blanks in the table. How had Q CORP's sustainable growth rate (SGR) changed over time? The formula for the sustainable growth rate is SGR = ROE*Retention Rate, or ROE*(1 - Dividend payout ratio). What caused any changes you found? Note that, when you compute the financial ratios for this homework, do not use average number but use only the single year figure. 2018 2017 2016 2015 2014 Return on equity Retention rate Sustainable growth rate Explain: b. The home furniture industry had the following ratios over the same time. How did Q CORP compare with the industry? Return on equity Retention rate Sustainable growth rate Explain: HOME FURNITURE INDUSTRY RATIOS 2017 15.54% 71.00% 11.03% 2018 15.12% 71.00% 10.73% 2016 15.31% 71.00% 10.87% 2015 15.74% 72.00% 11.33%


