Answered step by step
Verified Expert Solution
Question
1 Approved Answer
1. Moving Averages. Use the below actual sales to calculate a three-month average which will be used as the forecast for next periods (chapter 14,
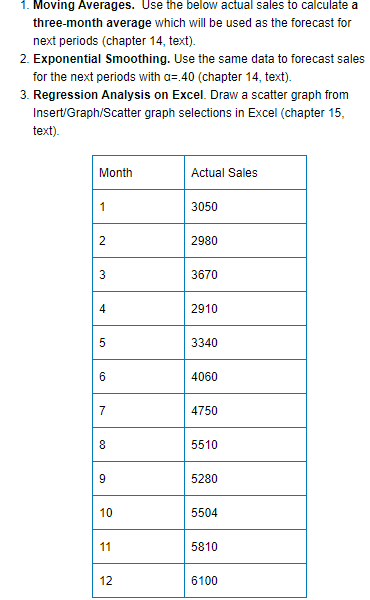
1. Moving Averages. Use the below actual sales to calculate a three-month average which will be used as the forecast for next periods (chapter 14, text) 2. Exponential Smoothing. Use the same data to forecast sales for the next periods with a.40 (chapter 14, text). 3. Regression Analysis on Excel. Draw a scatter graph from Insert/Graph/Scatter graph selections in Excel (chapter 15, text) Month Actual Sales 1 3050 2 2980 3670 2910 4 3340 6 4060 7 4750 8 5510 5280 9 10 5504 5810 11 12 6100 LO CO 1. Moving Averages. Use the below actual sales to calculate a three-month average which will be used as the forecast for next periods (chapter 14, text) 2. Exponential Smoothing. Use the same data to forecast sales for the next periods with a.40 (chapter 14, text). 3. Regression Analysis on Excel. Draw a scatter graph from Insert/Graph/Scatter graph selections in Excel (chapter 15, text) Month Actual Sales 1 3050 2 2980 3670 2910 4 3340 6 4060 7 4750 8 5510 5280 9 10 5504 5810 11 12 6100 LO CO
Step by Step Solution
There are 3 Steps involved in it
Step: 1
Get Instant Access to Expert-Tailored Solutions
See step-by-step solutions with expert insights and AI powered tools for academic success
Step: 2
Step: 3
Ace Your Homework with AI
Get the answers you need in no time with our AI-driven, step-by-step assistance
Get Started