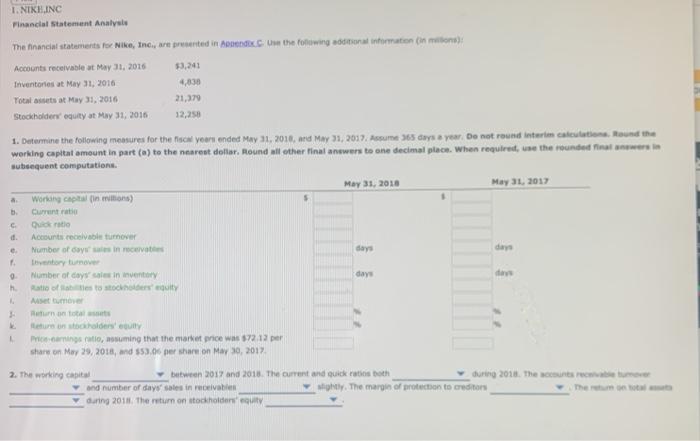
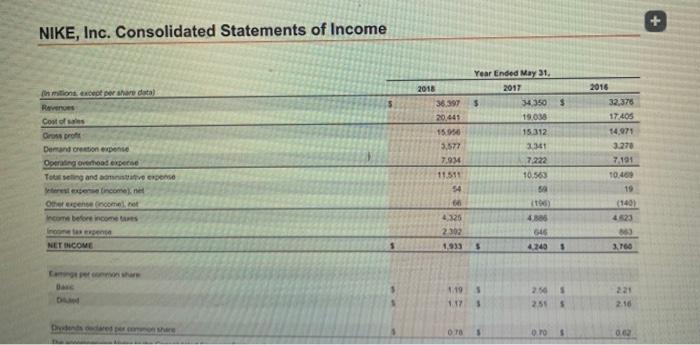
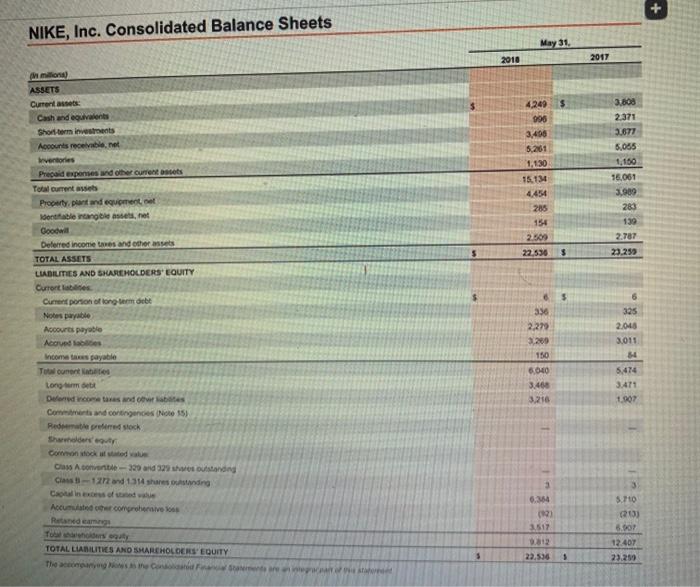
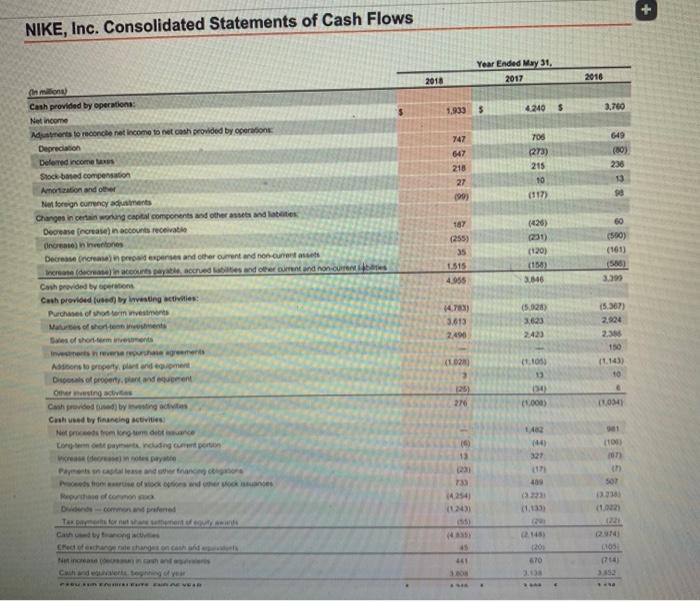
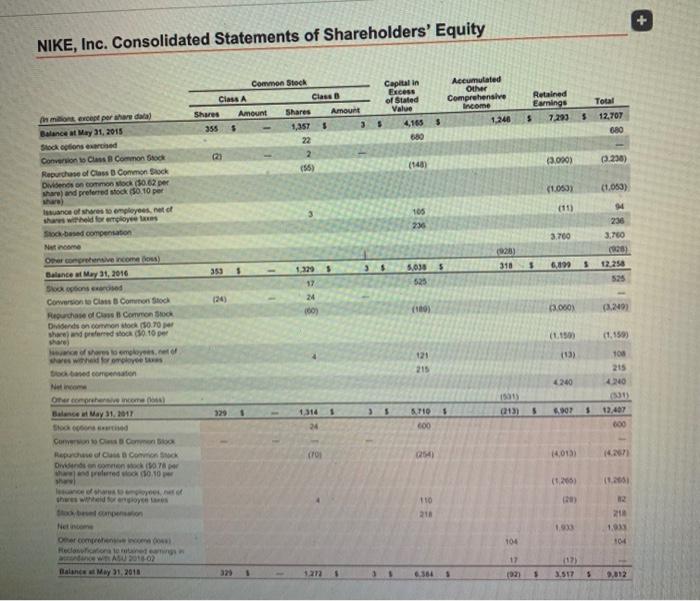
1. NIKHINC Financial Statement Analyse The financial statements for Nike, Inc., are presented in the owing additional information: $3,241 Accounts receivable at May 31, 2016 Inventories at May 31, 2016 Total assets at May 31, 2016 Stockholders' equity at May 31, 2016 4,038 21,379 12,250 1. Determine the following measures for the years ended May 31, 2018, and May 31, 2017. Assume 365 days a year. Do not round interim calculation Round the working capital amount in part() to the nearest dollar. Round all other final answers to one decimal place when required, use the rounded that we subsequent computations May 31, 2010 May 31, 2017 Working in min) Current Quote Accounts receivable turnover Number of days since daye day Inventory tumover Number of days sales in inventory days Ratio of the toto nenuity Heurs ondersteun Price camins ratio, suming that the market price was $72.12 per share on May 29, 2018, and 553.00 per share on May 10, 2017 2. The working capital between 2017 and 2018. The current and quick to oth during 2018. The most recent and number of days sales in receivables why. The margin of protection to creditors during 2011. The return on stockholders' equity NIKE, Inc. Consolidated Statements of Income 5 2018 36.397 20.441 $ Ihmin e pershare data) Ravno Costosas Oros pro Der and creation expense Operating overhead experne Tobing and more Year Ended May 21, 2017 $ 34,350 19,038 15.312 1341 15.50 3,577 7.94 2016 32,376 17405 14.971 3.270 7,191 10.462 19 (140) 7.222 11.511 54 Income before comes 4 325 2302 1.933 438 6456 4240 NET INCOME $ $ $ 3.160 $ 3 5 119 117 $ 255 $ 2.10 0.70 . + NIKE, Inc. Consolidated Statements of Comprehensive Income 2018 Year Ended May 31, 2017 1.33 $ 4.240 2016 $ 2.700 Net income Other comprehensive income oss), net of tax Change in nettoreign currency translation justment Change innan osses) on cash fowe Charonne gains ons on the Total other comprensive income (ostet TOTAL COMPREHENSIVE INCOME (0) 76 34 104 16 (515) (32) (178) 07573 5 1928) 2.892 (531 3,709 2,037 $ 5 NIKE, Inc. Consolidated Balance Sheets May 31, 2010 2017 $ 4,249 996 3,400 5.261 3.800 2371 36677 6,055 1,150 16.061 3.989 283 139 16.134 4.454 285 154 2.500 2.787 22.530 3 23.259 ASSETS Current Cash and equivalent Short-term investments Accounts receivable, Inventories Prepaid expenses and other current Total current Property plant and equipment Identifiable vanglasset, niet Goodwill Deferred income and others TOTAL ASSETS LIABILITIES AND SHAREHOLDERS' EQUITY Currontier Current portion of long-term debt Notes payable Accounts payable Acords com as payable To onontato Long De come as and was Come and contingences Note 15 Reda predstock 5 6 336 2.279 3.209 190 6 325 2.046 3.011 6.000 3460 3216 6,474 3:47: 1.007 Aconv-220 and 329 standing Class 12 and 134 shares standing 3 3 Acum comprehensive 6.354 (2) 3.517 812 3.70 03 5.00 12.407 23.259 TOTAL LIABILITIES AND SHAREHOLDERS' EQUITY 22,536 5 313 3. 4.249 $ S 3.105 $ 3.138 CASH AND EQUIVALENTS, END OF YEAR Supplemental disclosure of cash now information Cash Pad during the year for 125 70 74 Nos constant and event Od declared noted 204 200 700 200 300 27 NIKE, Inc. Consolidated Statements of Shareholders' Equity Capital in Excess of Stated Value 4,165 650 Accumulated Other Comprehensive Income 1.246 Common Stock Class A Class Shares Amount Shares Amount 355 $ 1,357 22 20 2 Retained Earnings $ 7.293 $ Total 12,707 680 in milion evene por share data) Balance at May 31, 2015 Stock options ered Conversion is Class Common Stock Repurchase of Class Common Stock Divides on Mono ($0.62 per whare and preferred stock 50.10 per $ (148) 13.060) 0.236) (105) (1.053) 105 236 4 236 3.760 (920 3.700 (925) 3$ $ 318 5 5,090 $ 12.250 Issuance of the employees net of share withold foremos a based compensation Nam Omer convences) Balance Mary 31, 2016 Shokonser Coronto Class Common Stock Rochase of CB Common Dends on common stock (10.70 where and preferred to per 525 1.3295 17 24 60) (100) 3.000) (1.1503 (1.159) of my 100 121 215 4240 Netico One comprehensive income Balance May 31, 2011 4240 (31 12.407 1316 1 (13) 5 07 . 1105 600 24 054) 14.013) Commons Carensis Repues como One 78 peredok 0,10 th (1260) 110 218 21 1983 104 104 Net Overcom Reclame WARU 2018-02 Balance May 31, 2011 1 327 . 3 361 (9 1 3.5175 9,812 1. NIKHINC Financial Statement Analyse The financial statements for Nike, Inc., are presented in the owing additional information: $3,241 Accounts receivable at May 31, 2016 Inventories at May 31, 2016 Total assets at May 31, 2016 Stockholders' equity at May 31, 2016 4,038 21,379 12,250 1. Determine the following measures for the years ended May 31, 2018, and May 31, 2017. Assume 365 days a year. Do not round interim calculation Round the working capital amount in part() to the nearest dollar. Round all other final answers to one decimal place when required, use the rounded that we subsequent computations May 31, 2010 May 31, 2017 Working in min) Current Quote Accounts receivable turnover Number of days since daye day Inventory tumover Number of days sales in inventory days Ratio of the toto nenuity Heurs ondersteun Price camins ratio, suming that the market price was $72.12 per share on May 29, 2018, and 553.00 per share on May 10, 2017 2. The working capital between 2017 and 2018. The current and quick to oth during 2018. The most recent and number of days sales in receivables why. The margin of protection to creditors during 2011. The return on stockholders' equity NIKE, Inc. Consolidated Statements of Income 5 2018 36.397 20.441 $ Ihmin e pershare data) Ravno Costosas Oros pro Der and creation expense Operating overhead experne Tobing and more Year Ended May 21, 2017 $ 34,350 19,038 15.312 1341 15.50 3,577 7.94 2016 32,376 17405 14.971 3.270 7,191 10.462 19 (140) 7.222 11.511 54 Income before comes 4 325 2302 1.933 438 6456 4240 NET INCOME $ $ $ 3.160 $ 3 5 119 117 $ 255 $ 2.10 0.70 . + NIKE, Inc. Consolidated Statements of Comprehensive Income 2018 Year Ended May 31, 2017 1.33 $ 4.240 2016 $ 2.700 Net income Other comprehensive income oss), net of tax Change in nettoreign currency translation justment Change innan osses) on cash fowe Charonne gains ons on the Total other comprensive income (ostet TOTAL COMPREHENSIVE INCOME (0) 76 34 104 16 (515) (32) (178) 07573 5 1928) 2.892 (531 3,709 2,037 $ 5 NIKE, Inc. Consolidated Balance Sheets May 31, 2010 2017 $ 4,249 996 3,400 5.261 3.800 2371 36677 6,055 1,150 16.061 3.989 283 139 16.134 4.454 285 154 2.500 2.787 22.530 3 23.259 ASSETS Current Cash and equivalent Short-term investments Accounts receivable, Inventories Prepaid expenses and other current Total current Property plant and equipment Identifiable vanglasset, niet Goodwill Deferred income and others TOTAL ASSETS LIABILITIES AND SHAREHOLDERS' EQUITY Currontier Current portion of long-term debt Notes payable Accounts payable Acords com as payable To onontato Long De come as and was Come and contingences Note 15 Reda predstock 5 6 336 2.279 3.209 190 6 325 2.046 3.011 6.000 3460 3216 6,474 3:47: 1.007 Aconv-220 and 329 standing Class 12 and 134 shares standing 3 3 Acum comprehensive 6.354 (2) 3.517 812 3.70 03 5.00 12.407 23.259 TOTAL LIABILITIES AND SHAREHOLDERS' EQUITY 22,536 5 313 3. 4.249 $ S 3.105 $ 3.138 CASH AND EQUIVALENTS, END OF YEAR Supplemental disclosure of cash now information Cash Pad during the year for 125 70 74 Nos constant and event Od declared noted 204 200 700 200 300 27 NIKE, Inc. Consolidated Statements of Shareholders' Equity Capital in Excess of Stated Value 4,165 650 Accumulated Other Comprehensive Income 1.246 Common Stock Class A Class Shares Amount Shares Amount 355 $ 1,357 22 20 2 Retained Earnings $ 7.293 $ Total 12,707 680 in milion evene por share data) Balance at May 31, 2015 Stock options ered Conversion is Class Common Stock Repurchase of Class Common Stock Divides on Mono ($0.62 per whare and preferred stock 50.10 per $ (148) 13.060) 0.236) (105) (1.053) 105 236 4 236 3.760 (920 3.700 (925) 3$ $ 318 5 5,090 $ 12.250 Issuance of the employees net of share withold foremos a based compensation Nam Omer convences) Balance Mary 31, 2016 Shokonser Coronto Class Common Stock Rochase of CB Common Dends on common stock (10.70 where and preferred to per 525 1.3295 17 24 60) (100) 3.000) (1.1503 (1.159) of my 100 121 215 4240 Netico One comprehensive income Balance May 31, 2011 4240 (31 12.407 1316 1 (13) 5 07 . 1105 600 24 054) 14.013) Commons Carensis Repues como One 78 peredok 0,10 th (1260) 110 218 21 1983 104 104 Net Overcom Reclame WARU 2018-02 Balance May 31, 2011 1 327 . 3 361 (9 1 3.5175 9,812
