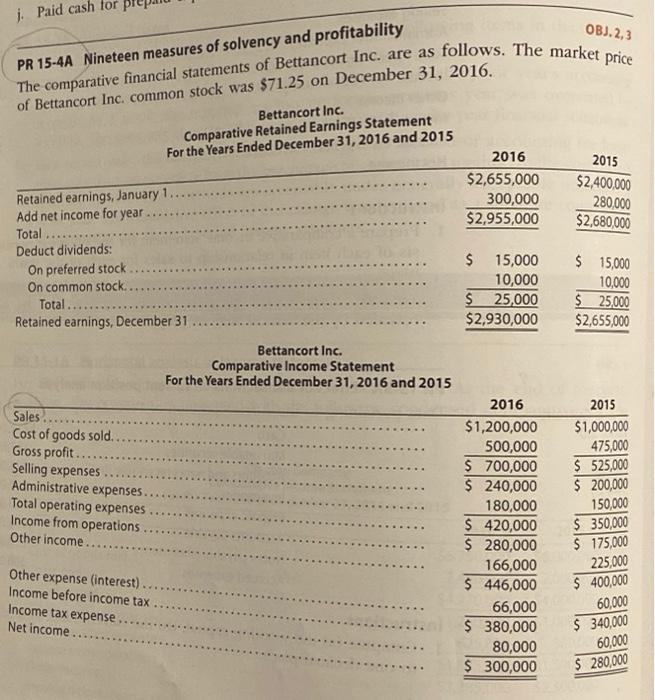
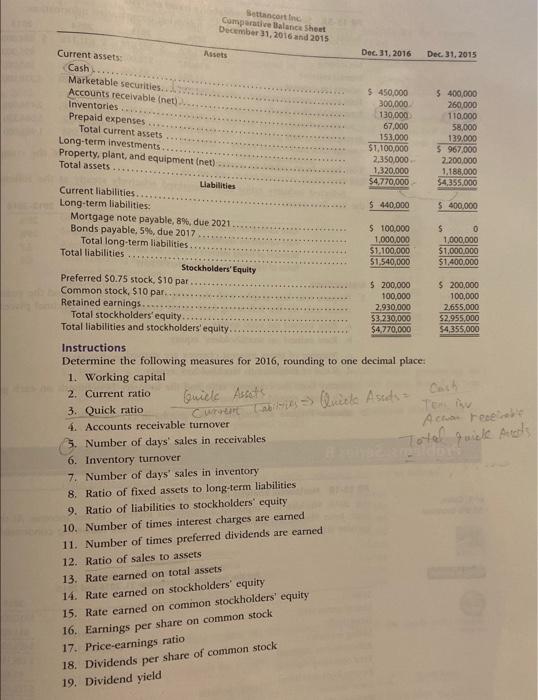
1. Paid cash for OBJ. 2,3 PR 15-4A Nineteen measures of solvency and profitability The comparative financial statements of Bettancort Inc. are as follows. The market price of Bettancort Inc. common stock was $71.25 on December 31, 2016. Bettancort Inc. Comparative Retained Earnings Statement For the Years Ended December 31, 2016 and 2015 2016 $2,655,000 300,000 $2,955,000 2015 $2,400,000 280,000 $2,680,000 Retained earnings, January 1 Add net income for year Total Deduct dividends: On preferred stock On common stock Total... Retained earnings, December 31 $ 15,000 10,000 $ 25,000 $2,930,000 $ 15,000 10,000 $ 25,000 $2,655,000 Bettancort Inc. Comparative Income Statement For the Years Ended December 31, 2016 and 2015 Sales Cost of goods sold.. Gross profit. Selling expenses Administrative expenses. Total operating expenses Income from operations Other income 2016 $1,200,000 500,000 $ 700,000 $ 240,000 180,000 $ 420,000 $ 280,000 166,000 $ 446,000 66,000 $ 380,000 80,000 $ 300,000 2015 $1,000,000 475,000 $ 525,000 $ 200,000 150,000 $ 350,000 $ 175,000 225,000 $ 400,000 Other expense interest) Income before income tax Income tax expense Net income.. 60,000 $ 340,000 60,000 $ 280,000 Settacortine Cumparative Balance Sheet December 31, 2016 and 2015 Dec 31, 2016 Dec 31, 2015 Assets Current assets: Cash Marketable securities. Accounts receivable (net)... Inventories Prepaid expenses Total current assets Long-term investments Property, plant, and equipment (net) Total assets Liabilities Current liabilities Long-term liabilities: Mortgage note payable, 8%, due 2021 Bonds payable. 5%, due 2017 Total long-term liabilities.. Total liabilities Stockholders' Equity Preferred $0.75 stock, $10 par Common stock, $10 par. Retained earnings. Total stockholders' equity Total liabilities and stockholders' equity $ 450,000 300,000 130,000 67.000 153,000 51.100.000 2.350,000 1,320,000 $4.770,000 $ 400,000 260,000 110,000 58,000 139.000 $ 967,000 2.200,000 1.188,000 $4.355.000 $ 440.000 $ 400,000 $ 100,000 1,000,000 $1,100,000 51.540,000 s 0 1,000,000 $1,000,000 $1.400.000 Cash Curver => Quizle Astea Total quick And $ 200,000 $ 200,000 100,000 100,000 2.930,000 2,655.000 $3230,000 $2.955.000 $4.770,000 $4,355,000 Instructions Determine the following measures for 2016, rounding to one decimal place: 1. Working capital 2. Current ratio Guicle Asset 3. Quick ratio Teninu 4. Accounts receivable turnover Ac Free 5. Number of days' sales in receivables 6. Inventory turnover 7. Number of days' sales in inventory 8. Ratio of fixed assets to long-term liabilities 9. Ratio of liabilities to stockholders' equity 10. Number of times interest charges are eamed 11. Number of times preferred dividends are earned 12. Ratio of sales to assets 13. Rate earned on total assets 14. Rate earned on stockholders' equity 15. Rate earned on common stockholders' equity 16. Earnings per share on common stock 17. Price earnings ratio 18. Dividends per share of common stock 19. Dividend yield