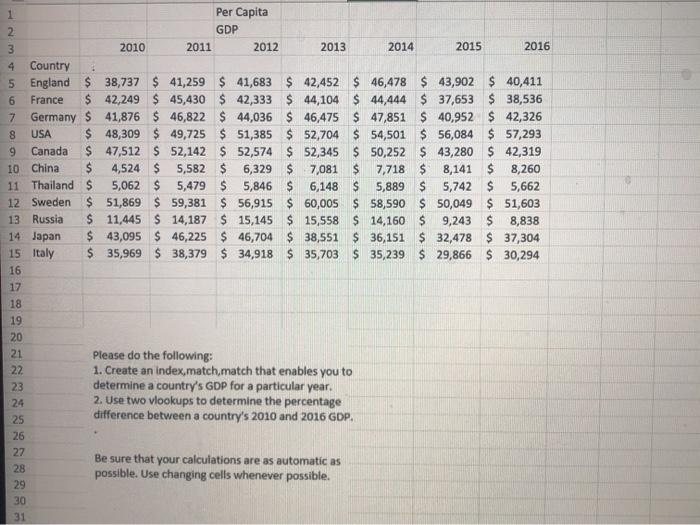
1 Per Capita 2 GDP 3 2010 2011 2012 2013 2014 2015 2016 4 Country 5 England $ 38,737 $ 41,259 $ 41,683 $ 42,452 $ 46,478 $ 43,902 $ 40,411 6 France $ 42,249 $ 45,430 $ 42,333 $ 44,104 $ 44,444 $ 37,653 $ 38,536 7 Germany $ 41,876 $ 46,822 $ 44,036 $46,475 $ 47,851 $ 40,952 $ 42,326 8 USA $ 48,309 $ 49,725 $ 51,385 $ 52,704 $ 54,501 $ 56,084 $ 57,293 9 Canada $ 47,512 $ 52,142 $ 52,574 $ 52,345 $ 50,252 $ 43,280 $ 42,319 10 China $ 4,524 $ 5,582 6,329 7,081 $ 7,718 $ 8,141 $ 8,260 11 Thailand $ 5,062 $ 5,479 $ 5,846 $ 6,148 $ 5,889 S 5,742 $ 5,662 12 Sweden $ 51,869 $ 59,381 $ 56,915 $ 60,005 $ 58,590 $ 50,049 $ 51,603 13 Russia $ 11,445 S 14,187 $ 15,145 $ 15,558 $ 14,160 $ 9,243 $ 8,838 14 Japan $ 43,095 $ 46,225 $ 46,704 $ 38,551 $36,151 $ 32,478 $ 37,304 15 Italy $ 35,969 $ 38,379 $ 34,918 $ 35,703 $ 35,239 $ 29,866 $ 30,294 16 17 18 19 20 21 Please do the following: 22 1. Create an index,match, match that enables you to 23 determine a country's GDP for a particular year. 24 2. Use two vlookups to determine the percentage 25 difference between a country's 2010 and 2016 GDP. 26 27 Be sure that your calculations are as automatic as 28 possible. Use changing cells whenever possible. 29 30 31 1 Per Capita 2 GDP 3 2010 2011 2012 2013 2014 2015 2016 4 Country 5 England $ 38,737 $ 41,259 $ 41,683 $ 42,452 $ 46,478 $ 43,902 $ 40,411 6 France $ 42,249 $ 45,430 $ 42,333 $ 44,104 $ 44,444 $ 37,653 $ 38,536 7 Germany $ 41,876 $ 46,822 $ 44,036 $46,475 $ 47,851 $ 40,952 $ 42,326 8 USA $ 48,309 $ 49,725 $ 51,385 $ 52,704 $ 54,501 $ 56,084 $ 57,293 9 Canada $ 47,512 $ 52,142 $ 52,574 $ 52,345 $ 50,252 $ 43,280 $ 42,319 10 China $ 4,524 $ 5,582 6,329 7,081 $ 7,718 $ 8,141 $ 8,260 11 Thailand $ 5,062 $ 5,479 $ 5,846 $ 6,148 $ 5,889 S 5,742 $ 5,662 12 Sweden $ 51,869 $ 59,381 $ 56,915 $ 60,005 $ 58,590 $ 50,049 $ 51,603 13 Russia $ 11,445 S 14,187 $ 15,145 $ 15,558 $ 14,160 $ 9,243 $ 8,838 14 Japan $ 43,095 $ 46,225 $ 46,704 $ 38,551 $36,151 $ 32,478 $ 37,304 15 Italy $ 35,969 $ 38,379 $ 34,918 $ 35,703 $ 35,239 $ 29,866 $ 30,294 16 17 18 19 20 21 Please do the following: 22 1. Create an index,match, match that enables you to 23 determine a country's GDP for a particular year. 24 2. Use two vlookups to determine the percentage 25 difference between a country's 2010 and 2016 GDP. 26 27 Be sure that your calculations are as automatic as 28 possible. Use changing cells whenever possible. 29 30 31