Answered step by step
Verified Expert Solution
Question
1 Approved Answer
1 Please find the question below and complete the worksheets titled Ratio&CF: CinsizeV, CmnsizeH', & 'Amorisch' (find out the values/fill out 2. This google sheet
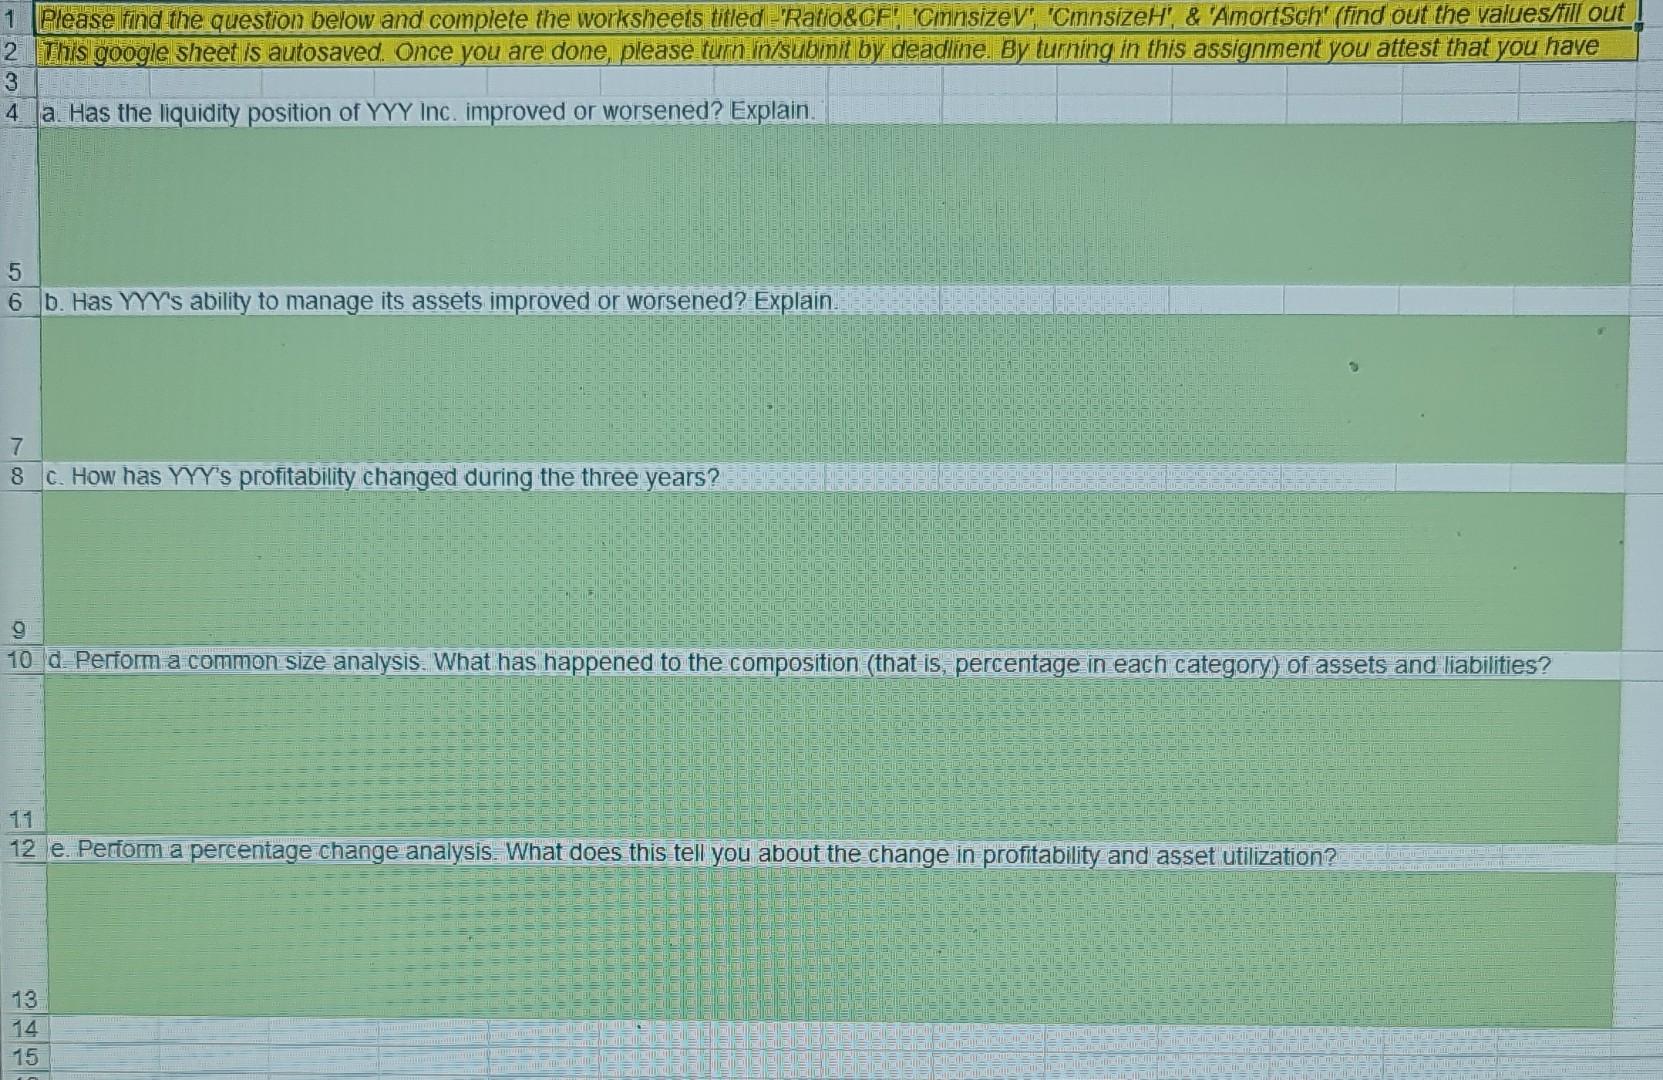
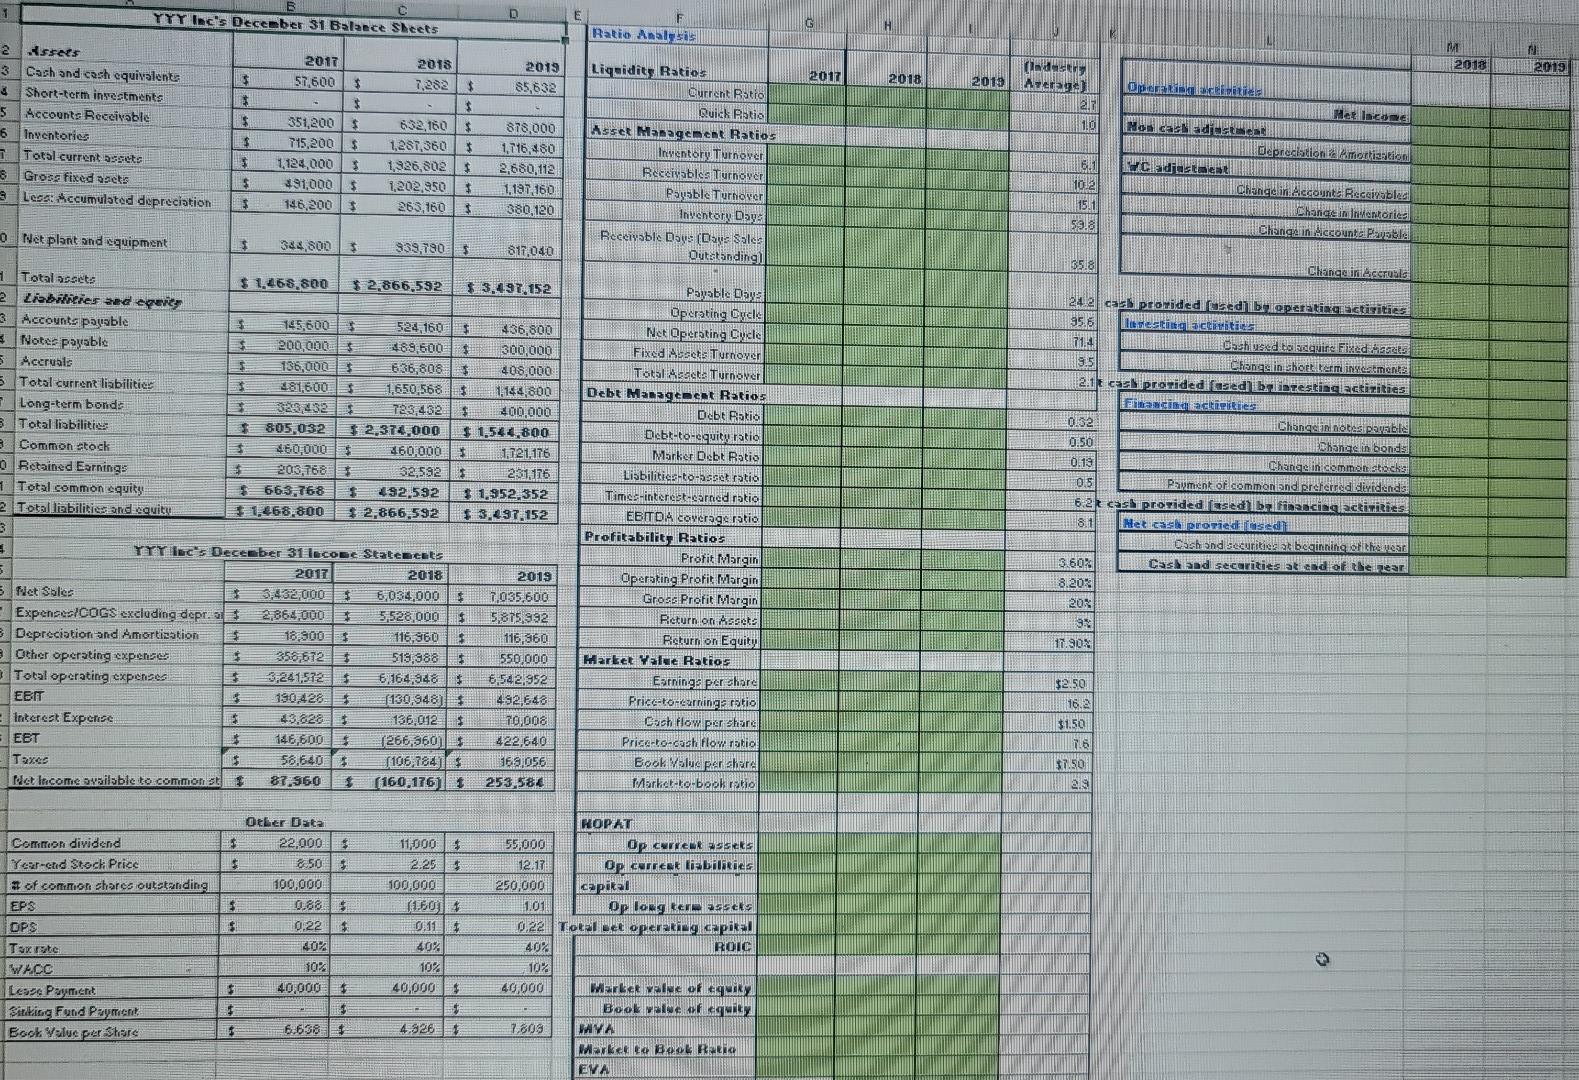
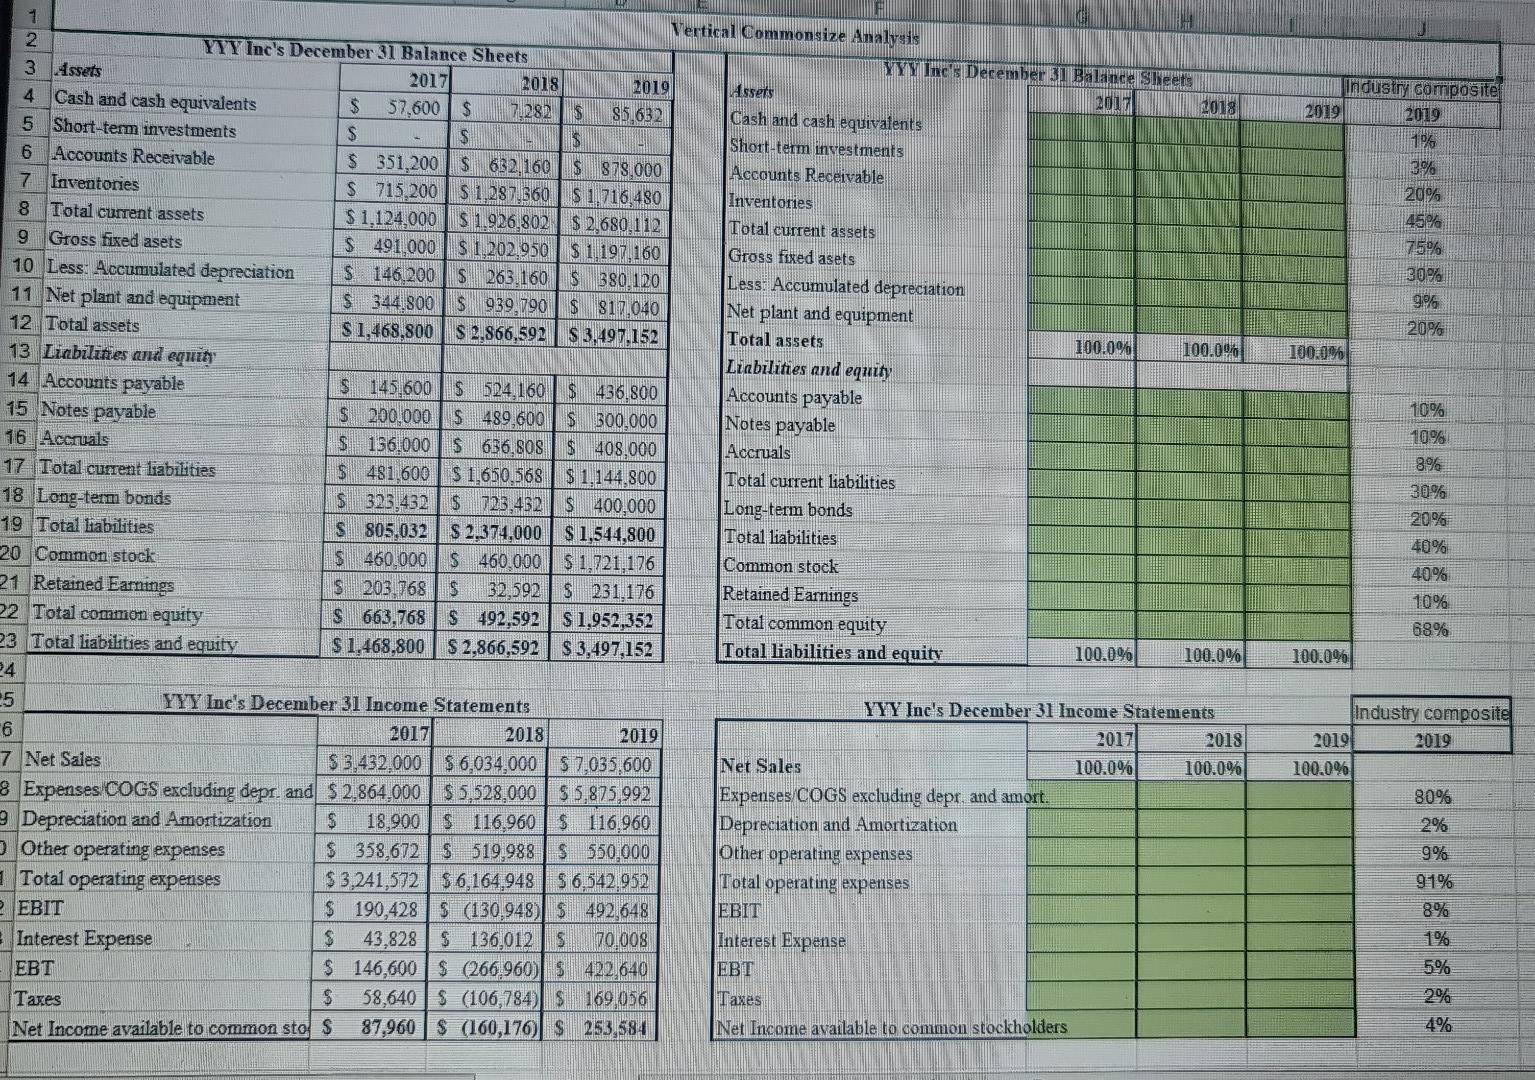
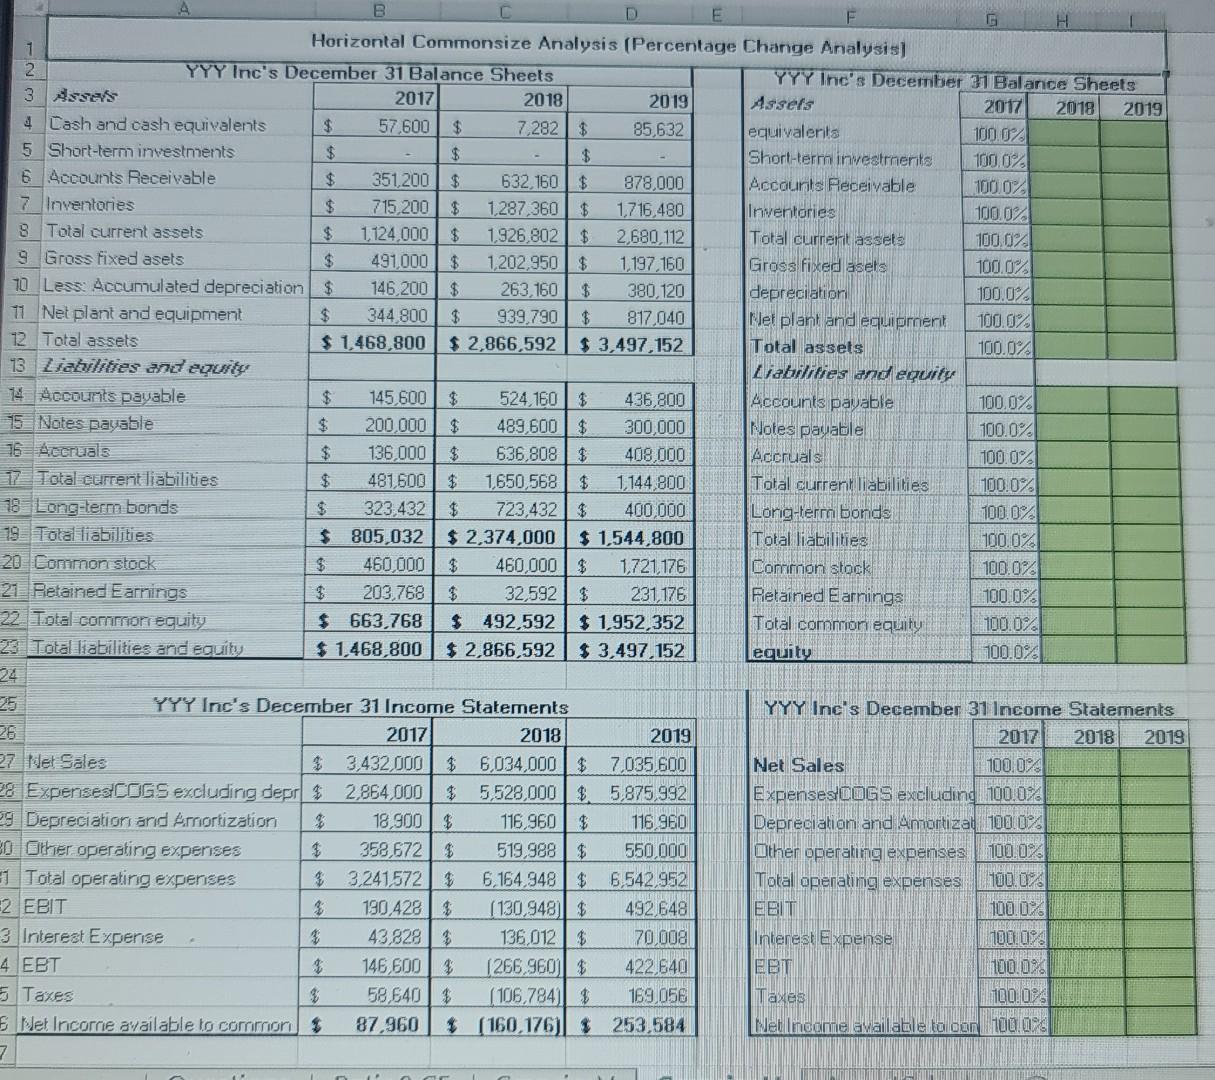
1 Please find the question below and complete the worksheets titled "Ratio&CF: CinsizeV", "CmnsizeH', & 'Amorisch' (find out the values/fill out 2. This google sheet is autosaved. Once you are done, please turn in/subinit by deadline. By turning in this assignment you attest that you have 3 4 a. Has the liquidity position of YYY Inc. improved or worsened? Explain. 5 6 b. Has YYY's ability to manage its assets improved or worsened? Explain. 7 8 C. How has YYY's profitability changed during the three years? 9 10 d. Perfom a common size analysis. What has happened to the composition (that is, percentage in each category) of assets and liabilities? 11 12 e. Perfom a percentage change analysis. What does this tell you about the change in profitability and asset utilization? 13 14 15 YYY Inc's December 31 Balance Sheets D E G Ratio Analysis 2017 2018 M 2018 2019 3 57,600 2019 85,632 2017 $ 2018 2013 2 Assets 3 Cash and cash equivalent 3 Short-term investments 5 Accounts Receivable 6 Inventories T Total current assets 8 Gross fixed asets 9 Lecc: Accumulated depreciation (inder Azego) 2. 10 $ 5 $ 351,200 $ 715,200 $ 1124,000 $ 191,000 $ 746,200 $ $ 632,160 $ 1,287,360 1.926,8025 1,202,950 $ 263,160 878,000 1,716,480 2,680,112 1,197 160 380,120 Liquidit, Ratios Current Ratio Quick Ratio Asset Management Ratios Inventory. Turnover Receivables Turnover Paysble Turnover Inventory Days Receivable Days (Days Sales Outstanding D cities Het Income Nos caducand Depreciation. Amortization Caductnese Change in Account Receivables Change in Inventorie Change in Accounts Payable $ 601 102 15. 59.8 $ Net plant and equipment $ 384,800 $ 339.780 $ 817,040 2518 Chance in estul 1 Total assets $ 1,468,800 $ 2,866,592 $ 3.497,152 2 Liabilities adeqeritz 3 Accounts payable 145,600 522 160 $ 436,800 Notez payable 200,000 $ 489,600 $ 300,000 5 Accruals 136,000 636,808 $ 408,000 5 Total current liabilities 281,600 1,650,568 1.144.800 Long-term bonda Ta3,432 400,000 3 Total liabilities 805 032 $ 2,374,000 $ 1,544,800 e Common stock 260.000 260.0003 1.121.176 o Retained Earning: 203,768 32,592 231,176 1 Total common squity 663 768 $ 492,592 $1.952.352 2 Total liabilities and equitu 1268,800 $ 2,866,592 $ 3.497.152 3 YYY is December 31 lecone State cats 2017 2018 2019 5 Net Sale: 432,000 6,034,000 7,035,600 ExpenceICOGS excluding dept.al 2,864,000 3 5,528 000 $ 5,875 932 Depreciation and Amortization 18.900 3 116,3603 116,360 Other operating expenses $ 356672 $ 513,388 3 550.000 Total operating expenses 3,241572 6,164,948 $ 6,542,952 EBIT (130,948) 492,648 Interest Expense 43,828 136,012 3 10,008 EBT 146,6003 (266, 36005 422,640 Taxes $ 58.64023 (106,78413 1681056 Net Income available to commonst 87,960 (160.176) 253 584 Payable Daya Operating Cycle Net Operating Cycle Fixed Absets Turnover Total act: Turnover Debt Management Ratios Debt Ratio Debt-to-equity ratio Marker Debt Ratio Lisbilities-to-asset ratio Time:-interest-earned ratio EBITDA coverage ratio Profitability Ratios Profit Cargin Operating Profit Margin Gross Profit Margin Return on Assets Return on Equity Harket Value Ratios Earning: percharel Price-to-earnings rstio Cash flow per chare Price to cash flow ratio Book Value percher Market-to-book ratio 242 cas provided used bloperating activities 95.6 testing activiti 71.4 Cash used to acquire Fixed sets 19.5 Change in short term investments 2.1 cask prorided med blintesting actitities Dancindeactirities TEL 0.32 Chongsunnotes papable 0.50 Change in bonds 0.19 Change in common stocks 0.5 Payment of common and preferred dividend 6.2 t cash provided lasedli financing activities 8011 Het cash proriedased Cach and securities beginning of the pear 3.60% Cask and securities at end of the lear 8.202 20% 13 11.90% $2.50 16. $1.50 1.6 $7.50 2.5 $ Other Data 22.000 6.50 100,000 $ 5 Common dividend Year-end Stock Price # of common share outstanding EPS OPS Tarrate WACC Lease Payment Sitting Fund Payment Book Value per Share 11,000 2.25 100,000 (1.60) 0911 40% 10% 40,000 0.22 20% HOPAT 55,000 Op currek esets 12.17 OPALCER Liabilities 250,000 capital 1.01 Op long kemasseks 0.22 Total met operating capital 40% ROIC 10% 40,000 market value of equiry Boorweeguity WYA Make to Book Raid EVA 10% 40,000 3 6.638 4.826 industry composite 2019 2019 1% No on 20% 45% 75% 30% 9% 20% 100.0% 1 Vertical Commonsize Analysis 2 YYY Inc's December 31 Balance Sheets YYYHDecember 31 Balance sheets 3 Assets 2017 2018 2019 Assets 2017 2018 4 Cash and cash equivalents $ 57,600 $ 71282 $ 85.632 Cash and cash equivalents 5 Short-term investments $ $ $ Short-term investments 6 Accounts Receivable $ 351,200 $ 632,160 S 878,000 Accounts Receivable Inventories $ 715,200 $ 1,287,360 $ 1,716,480 Inventories 8 Total current assets $ 1.124.000 $ 1.926,802 $ 2,680.112 Total current assets 9 Gross fixed asets S 491,000 $ 1.202,950 $ 1,197,160 Gross fixed asets 10 Less: Accumulated depreciation $ 146,200 $ 263,160 S 380,120 Less: Accumulated depreciation 11 Net plant and equipment $ 344,800 S 939.790 S317,040 Net plant and equipment 12 Total assets $ 1,468,800 $ 2.866,592 S 3,497.152 Total assets 100.0% 100.000 13 Liabilities and equid Liabilities and equity 14 Accounts payable $145.600 $ 524.160 $ 436.800 Accounts payable 15 Notes payable $ 200,000 $ 489 600 $ 300,000 Notes payable 16 Accruals $ 136,000$ 636.808 $ 408,000 Accruals 17 Total current liabilities $ 481.600S 1.650,568 $ 1.144.800 Total current liabilities 18 Long-term bonds S 323,432 $ 723,432 $ 400,000 Long-term bonds 19 Total liabilities S 805,032 S 2.374,000 $1,544,800 Total liabilities 20 Common stock $ 460,000 S 460,000 $1,721,176 Common stock 21 Retained Earnings $ 203.768 $ 32,592 S 231,176 Retained Earnings 22 Total common equity S 663.768 S 492,592 S 1,952,352 Total common equity 23 Total liabilities and equity $ 1,468.800 S 2,866,592 $3,497,152 Total liabilities and equity 100.0% 100.0% 24 25 YYY Ine's December 31 Income Statements YYY Inc's December 31 Income Statements 2017 6 2018 2019 2017 2018 100.0% 7 Net Sales Net Sales 100.0% $ 3.432,000 S 6,034,000 S 7,035 600 8 Expenses COGS excluding depr. and $ 2,864,000$ 5,528,000$ 5,875,992 Expenses COGS excluding depr, and amort. 9 Depreciation and Amortization $ 18.900 $ 116.960 $ 116.960 Depreciation and Amortization Other operating expenses $ 358,672 $ 519,988 S 550.000 Other operating expenses Total operating expenses $3,241,572 56,164,948 56.542,952. Total operating expenses EBIT $ 190,428S (130,948) $ 492,648 EBIT Interest Expense $ 43,828 $ 136,012 s 70.008 Interest Expense EBT $ 146,600 $ (266.960) $ 422,640 EBT Taxes $ 58,640$ (106,784) $ 169,056 Taxes Net Income available to common sto s 87,960 $ (160,176) S. 253.584 Net Income available to common stockholders 10% 10% 8% 30% 20% 40% 40% 10% 68% 100.0% Industry composite 2019 2019 100.0% 80% 2% 9% 91% 8% 1% 5% 2% 4% B D G H Horizontal Commonsize Analysis (Percentage Change Analysis 1 2 YYY Inc's December 31 Balance Sheets YYY Inc's December 31 Balance Sheets 3 Assets 2017 2018 2019 2017 2018 2019 4 Cash and cash equivalents $ 57,600 $ 7,282 $ 85,632 equivalents 100.0% 5 Short-term investments $ $ $ Short-term investments 100.0% 6 Accounts Receivable $ 351,200 $ 632,160 $ 878,000 Accounts Receivable 100.0% 7 Inventories $ 715,200 $ 1,287,360 $ 1,716,480 Inventories 100.0% 8 Total current assets $ 1,124,000 $ 1.926,802 $ 2,680.112 Total current assets 100.0% 9 Gross fixed asets 491,000 $ 1,202,950 $ 1,197,160 Gross fixed asets 100.0% 70 Less: Accumulated depreciation $ 146,200 $ 263,160 % 380,120 depreciation 100.0% 11 Nel plant and equipment $ 344 800 939,790 $ 817,040 Nel plant and equipment 100.0% 12 Total assets $ 1,468,800 $ 2,866,592 $ 3,497,152 Total assets 100.0% 13 Liabilities and equity Labilities and equity 74 Secounts payable 145 600 $ 524.160 $ 436,800 Accounts payable 100.0% 15 Notes Bayable $ 200,000 $ 489,600 $ 300,000 Notes payable 100.0% 76ccruals $ 136,000 $ 636,808 $ 408,000 Accruals 100.0% 7 Total current liabilities $ 481,600 $ 1,650,568 $ 1,144.800 Total current liabilities 100.0% 118 Long-term bonds $ 323,432 $ 723,432 $ 400.000 Long-terra bonds 100.0% 19Total liabilities $ 805,032 $ 2,374,000 $ 1,544,800 Total liabilities 100.0% 20 Common stock $ 460,000 $ 460,000 $ 1,721,176 Common stock 100.0% 21 Betained Earnings 203,768 $ 32,592 $ 231,176 Retained Earnings 100.0% 22 Total common equity $ 663,768 $ 492,592 $ 1,952,352 Total common equity 100.0% RAUMA 23 Total liabilities and equity $ 1,468,800 $ 2,866,592 $ 3,497,152 equity 100.0% 24 YYY Inc's December 31 Income Statements YYY Inc's December 31 Income Statements 26 2017 2018 2019 2017 2018 2019 27 Net Sales $ 3,432,000 $ 6,034,000 $ 7,085,600 Net Sales 100.0% 28 Expenses COGS excluding depr $ 2,864,000 5,528,000 $ 5,875,992 Expenses/DOGS excluding 100.0% 9 Depreciation and Amortization 18,900 $ 116,960 $ 116.960 Depreciation and Amortiza 100.0% 30 Other operating expenses $ 358,672 % 519,988 $ 550.000 Other operating expenses 100.0% 1 Total operating expenses $ 3,241,572 % 6.164,948$ 6,542.952 Total operating expenses 100.0 2 EBIT $ 190,428 $ ( 130,948) $ 492 648 EBIT 100.0 3 Interest Expense I 43,828 $ 136,012$ 70.008 Interest Expense 100.0% 4 EBT $ 146,600 $ 1266,960 $ 422,640 EBT 100.0% 5 Taxes $ 58,640 $ (106,784)) $ 169,056 Taxes 100.0 Net Incore available to common $ 87,960 $ (160,176)) $ 253,584 Net moome available to con 100.0% 7 1 Please find the question below and complete the worksheets titled "Ratio&CF: CinsizeV", "CmnsizeH', & 'Amorisch' (find out the values/fill out 2. This google sheet is autosaved. Once you are done, please turn in/subinit by deadline. By turning in this assignment you attest that you have 3 4 a. Has the liquidity position of YYY Inc. improved or worsened? Explain. 5 6 b. Has YYY's ability to manage its assets improved or worsened? Explain. 7 8 C. How has YYY's profitability changed during the three years? 9 10 d. Perfom a common size analysis. What has happened to the composition (that is, percentage in each category) of assets and liabilities? 11 12 e. Perfom a percentage change analysis. What does this tell you about the change in profitability and asset utilization? 13 14 15 YYY Inc's December 31 Balance Sheets D E G Ratio Analysis 2017 2018 M 2018 2019 3 57,600 2019 85,632 2017 $ 2018 2013 2 Assets 3 Cash and cash equivalent 3 Short-term investments 5 Accounts Receivable 6 Inventories T Total current assets 8 Gross fixed asets 9 Lecc: Accumulated depreciation (inder Azego) 2. 10 $ 5 $ 351,200 $ 715,200 $ 1124,000 $ 191,000 $ 746,200 $ $ 632,160 $ 1,287,360 1.926,8025 1,202,950 $ 263,160 878,000 1,716,480 2,680,112 1,197 160 380,120 Liquidit, Ratios Current Ratio Quick Ratio Asset Management Ratios Inventory. Turnover Receivables Turnover Paysble Turnover Inventory Days Receivable Days (Days Sales Outstanding D cities Het Income Nos caducand Depreciation. Amortization Caductnese Change in Account Receivables Change in Inventorie Change in Accounts Payable $ 601 102 15. 59.8 $ Net plant and equipment $ 384,800 $ 339.780 $ 817,040 2518 Chance in estul 1 Total assets $ 1,468,800 $ 2,866,592 $ 3.497,152 2 Liabilities adeqeritz 3 Accounts payable 145,600 522 160 $ 436,800 Notez payable 200,000 $ 489,600 $ 300,000 5 Accruals 136,000 636,808 $ 408,000 5 Total current liabilities 281,600 1,650,568 1.144.800 Long-term bonda Ta3,432 400,000 3 Total liabilities 805 032 $ 2,374,000 $ 1,544,800 e Common stock 260.000 260.0003 1.121.176 o Retained Earning: 203,768 32,592 231,176 1 Total common squity 663 768 $ 492,592 $1.952.352 2 Total liabilities and equitu 1268,800 $ 2,866,592 $ 3.497.152 3 YYY is December 31 lecone State cats 2017 2018 2019 5 Net Sale: 432,000 6,034,000 7,035,600 ExpenceICOGS excluding dept.al 2,864,000 3 5,528 000 $ 5,875 932 Depreciation and Amortization 18.900 3 116,3603 116,360 Other operating expenses $ 356672 $ 513,388 3 550.000 Total operating expenses 3,241572 6,164,948 $ 6,542,952 EBIT (130,948) 492,648 Interest Expense 43,828 136,012 3 10,008 EBT 146,6003 (266, 36005 422,640 Taxes $ 58.64023 (106,78413 1681056 Net Income available to commonst 87,960 (160.176) 253 584 Payable Daya Operating Cycle Net Operating Cycle Fixed Absets Turnover Total act: Turnover Debt Management Ratios Debt Ratio Debt-to-equity ratio Marker Debt Ratio Lisbilities-to-asset ratio Time:-interest-earned ratio EBITDA coverage ratio Profitability Ratios Profit Cargin Operating Profit Margin Gross Profit Margin Return on Assets Return on Equity Harket Value Ratios Earning: percharel Price-to-earnings rstio Cash flow per chare Price to cash flow ratio Book Value percher Market-to-book ratio 242 cas provided used bloperating activities 95.6 testing activiti 71.4 Cash used to acquire Fixed sets 19.5 Change in short term investments 2.1 cask prorided med blintesting actitities Dancindeactirities TEL 0.32 Chongsunnotes papable 0.50 Change in bonds 0.19 Change in common stocks 0.5 Payment of common and preferred dividend 6.2 t cash provided lasedli financing activities 8011 Het cash proriedased Cach and securities beginning of the pear 3.60% Cask and securities at end of the lear 8.202 20% 13 11.90% $2.50 16. $1.50 1.6 $7.50 2.5 $ Other Data 22.000 6.50 100,000 $ 5 Common dividend Year-end Stock Price # of common share outstanding EPS OPS Tarrate WACC Lease Payment Sitting Fund Payment Book Value per Share 11,000 2.25 100,000 (1.60) 0911 40% 10% 40,000 0.22 20% HOPAT 55,000 Op currek esets 12.17 OPALCER Liabilities 250,000 capital 1.01 Op long kemasseks 0.22 Total met operating capital 40% ROIC 10% 40,000 market value of equiry Boorweeguity WYA Make to Book Raid EVA 10% 40,000 3 6.638 4.826 industry composite 2019 2019 1% No on 20% 45% 75% 30% 9% 20% 100.0% 1 Vertical Commonsize Analysis 2 YYY Inc's December 31 Balance Sheets YYYHDecember 31 Balance sheets 3 Assets 2017 2018 2019 Assets 2017 2018 4 Cash and cash equivalents $ 57,600 $ 71282 $ 85.632 Cash and cash equivalents 5 Short-term investments $ $ $ Short-term investments 6 Accounts Receivable $ 351,200 $ 632,160 S 878,000 Accounts Receivable Inventories $ 715,200 $ 1,287,360 $ 1,716,480 Inventories 8 Total current assets $ 1.124.000 $ 1.926,802 $ 2,680.112 Total current assets 9 Gross fixed asets S 491,000 $ 1.202,950 $ 1,197,160 Gross fixed asets 10 Less: Accumulated depreciation $ 146,200 $ 263,160 S 380,120 Less: Accumulated depreciation 11 Net plant and equipment $ 344,800 S 939.790 S317,040 Net plant and equipment 12 Total assets $ 1,468,800 $ 2.866,592 S 3,497.152 Total assets 100.0% 100.000 13 Liabilities and equid Liabilities and equity 14 Accounts payable $145.600 $ 524.160 $ 436.800 Accounts payable 15 Notes payable $ 200,000 $ 489 600 $ 300,000 Notes payable 16 Accruals $ 136,000$ 636.808 $ 408,000 Accruals 17 Total current liabilities $ 481.600S 1.650,568 $ 1.144.800 Total current liabilities 18 Long-term bonds S 323,432 $ 723,432 $ 400,000 Long-term bonds 19 Total liabilities S 805,032 S 2.374,000 $1,544,800 Total liabilities 20 Common stock $ 460,000 S 460,000 $1,721,176 Common stock 21 Retained Earnings $ 203.768 $ 32,592 S 231,176 Retained Earnings 22 Total common equity S 663.768 S 492,592 S 1,952,352 Total common equity 23 Total liabilities and equity $ 1,468.800 S 2,866,592 $3,497,152 Total liabilities and equity 100.0% 100.0% 24 25 YYY Ine's December 31 Income Statements YYY Inc's December 31 Income Statements 2017 6 2018 2019 2017 2018 100.0% 7 Net Sales Net Sales 100.0% $ 3.432,000 S 6,034,000 S 7,035 600 8 Expenses COGS excluding depr. and $ 2,864,000$ 5,528,000$ 5,875,992 Expenses COGS excluding depr, and amort. 9 Depreciation and Amortization $ 18.900 $ 116.960 $ 116.960 Depreciation and Amortization Other operating expenses $ 358,672 $ 519,988 S 550.000 Other operating expenses Total operating expenses $3,241,572 56,164,948 56.542,952. Total operating expenses EBIT $ 190,428S (130,948) $ 492,648 EBIT Interest Expense $ 43,828 $ 136,012 s 70.008 Interest Expense EBT $ 146,600 $ (266.960) $ 422,640 EBT Taxes $ 58,640$ (106,784) $ 169,056 Taxes Net Income available to common sto s 87,960 $ (160,176) S. 253.584 Net Income available to common stockholders 10% 10% 8% 30% 20% 40% 40% 10% 68% 100.0% Industry composite 2019 2019 100.0% 80% 2% 9% 91% 8% 1% 5% 2% 4% B D G H Horizontal Commonsize Analysis (Percentage Change Analysis 1 2 YYY Inc's December 31 Balance Sheets YYY Inc's December 31 Balance Sheets 3 Assets 2017 2018 2019 2017 2018 2019 4 Cash and cash equivalents $ 57,600 $ 7,282 $ 85,632 equivalents 100.0% 5 Short-term investments $ $ $ Short-term investments 100.0% 6 Accounts Receivable $ 351,200 $ 632,160 $ 878,000 Accounts Receivable 100.0% 7 Inventories $ 715,200 $ 1,287,360 $ 1,716,480 Inventories 100.0% 8 Total current assets $ 1,124,000 $ 1.926,802 $ 2,680.112 Total current assets 100.0% 9 Gross fixed asets 491,000 $ 1,202,950 $ 1,197,160 Gross fixed asets 100.0% 70 Less: Accumulated depreciation $ 146,200 $ 263,160 % 380,120 depreciation 100.0% 11 Nel plant and equipment $ 344 800 939,790 $ 817,040 Nel plant and equipment 100.0% 12 Total assets $ 1,468,800 $ 2,866,592 $ 3,497,152 Total assets 100.0% 13 Liabilities and equity Labilities and equity 74 Secounts payable 145 600 $ 524.160 $ 436,800 Accounts payable 100.0% 15 Notes Bayable $ 200,000 $ 489,600 $ 300,000 Notes payable 100.0% 76ccruals $ 136,000 $ 636,808 $ 408,000 Accruals 100.0% 7 Total current liabilities $ 481,600 $ 1,650,568 $ 1,144.800 Total current liabilities 100.0% 118 Long-term bonds $ 323,432 $ 723,432 $ 400.000 Long-terra bonds 100.0% 19Total liabilities $ 805,032 $ 2,374,000 $ 1,544,800 Total liabilities 100.0% 20 Common stock $ 460,000 $ 460,000 $ 1,721,176 Common stock 100.0% 21 Betained Earnings 203,768 $ 32,592 $ 231,176 Retained Earnings 100.0% 22 Total common equity $ 663,768 $ 492,592 $ 1,952,352 Total common equity 100.0% RAUMA 23 Total liabilities and equity $ 1,468,800 $ 2,866,592 $ 3,497,152 equity 100.0% 24 YYY Inc's December 31 Income Statements YYY Inc's December 31 Income Statements 26 2017 2018 2019 2017 2018 2019 27 Net Sales $ 3,432,000 $ 6,034,000 $ 7,085,600 Net Sales 100.0% 28 Expenses COGS excluding depr $ 2,864,000 5,528,000 $ 5,875,992 Expenses/DOGS excluding 100.0% 9 Depreciation and Amortization 18,900 $ 116,960 $ 116.960 Depreciation and Amortiza 100.0% 30 Other operating expenses $ 358,672 % 519,988 $ 550.000 Other operating expenses 100.0% 1 Total operating expenses $ 3,241,572 % 6.164,948$ 6,542.952 Total operating expenses 100.0 2 EBIT $ 190,428 $ ( 130,948) $ 492 648 EBIT 100.0 3 Interest Expense I 43,828 $ 136,012$ 70.008 Interest Expense 100.0% 4 EBT $ 146,600 $ 1266,960 $ 422,640 EBT 100.0% 5 Taxes $ 58,640 $ (106,784)) $ 169,056 Taxes 100.0 Net Incore available to common $ 87,960 $ (160,176)) $ 253,584 Net moome available to con 100.0% 7
Step by Step Solution
There are 3 Steps involved in it
Step: 1

Get Instant Access to Expert-Tailored Solutions
See step-by-step solutions with expert insights and AI powered tools for academic success
Step: 2

Step: 3
Ace Your Homework with AI
Get the answers you need in no time with our AI-driven, step-by-step assistance
Get Started