Answered step by step
Verified Expert Solution
Question
1 Approved Answer
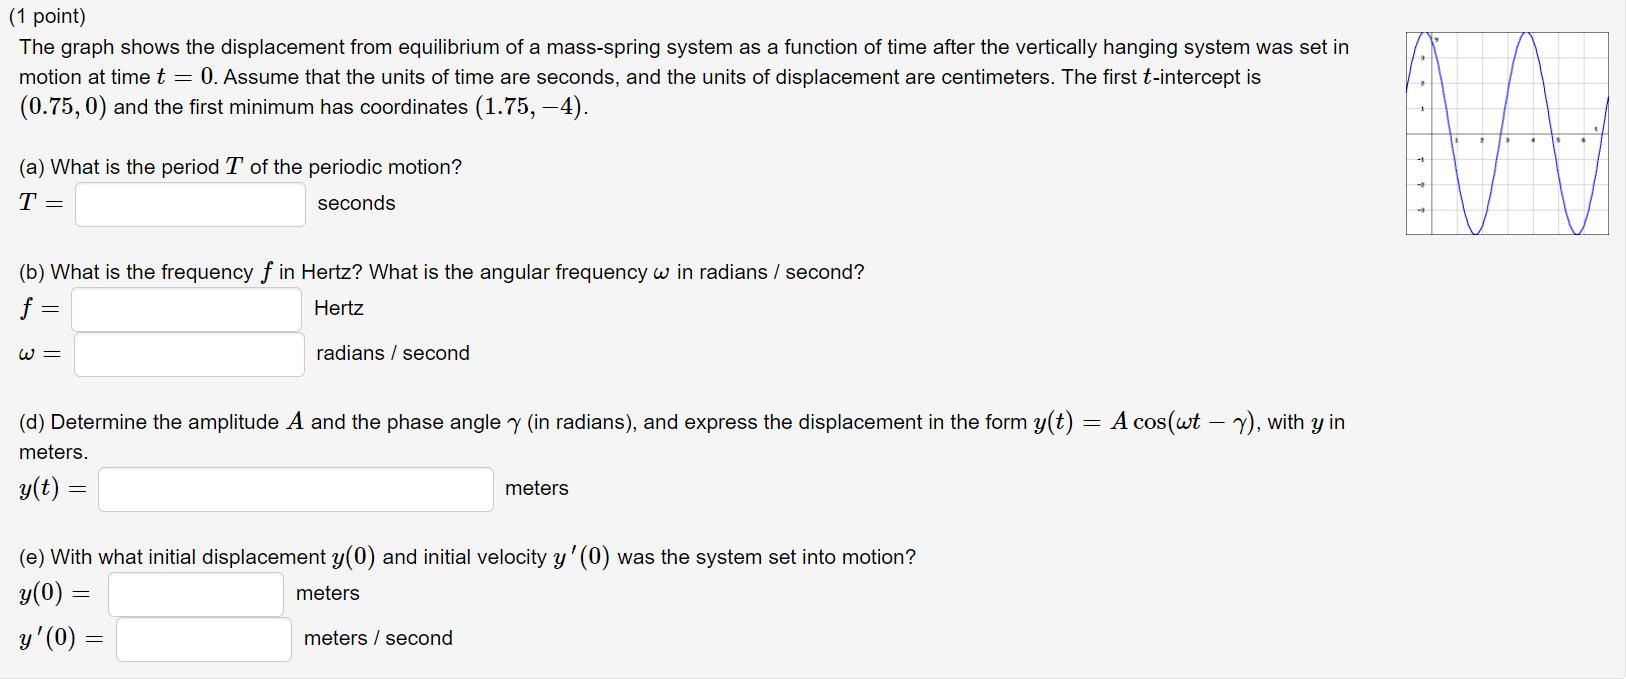
(1 point) The graph shows the displacement from equilibrium of a mass-spring system as a function of time after the vertically hanging system was

(1 point) The graph shows the displacement from equilibrium of a mass-spring system as a function of time after the vertically hanging system was set in motion at time t = 0. Assume that the units of time are seconds, and the units of displacement are centimeters. The first t-intercept is (0.75, 0) and the first minimum has coordinates (1.75, -4). (a) What is the period T of the periodic motion? T = seconds (b) What is the frequency f in Hertz? What is the angular frequency w in radians / second? f = Hertz W = radians / second (d) Determine the amplitude A and the phase angle y (in radians), and express the displacement in the form y(t) = A cos(wt - y), with y in %3D meters. y(t) = meters (e) With what initial displacement y(0) and initial velocity y'(0) was the system set into motion? y(0) = meters y'(0) = meters / second
Step by Step Solution
★★★★★
3.41 Rating (157 Votes )
There are 3 Steps involved in it
Step: 1
Massspring systems tend to follow SHM Taking units of displacement as ...
Get Instant Access to Expert-Tailored Solutions
See step-by-step solutions with expert insights and AI powered tools for academic success
Step: 2

Step: 3

Ace Your Homework with AI
Get the answers you need in no time with our AI-driven, step-by-step assistance
Get Started


