Answered step by step
Verified Expert Solution
Link Copied!

Question

1 Approved Answer

(1 point) The histogram below gives the length of service of members of the Department of Mathematics and Statistics at a particular university. The classes,
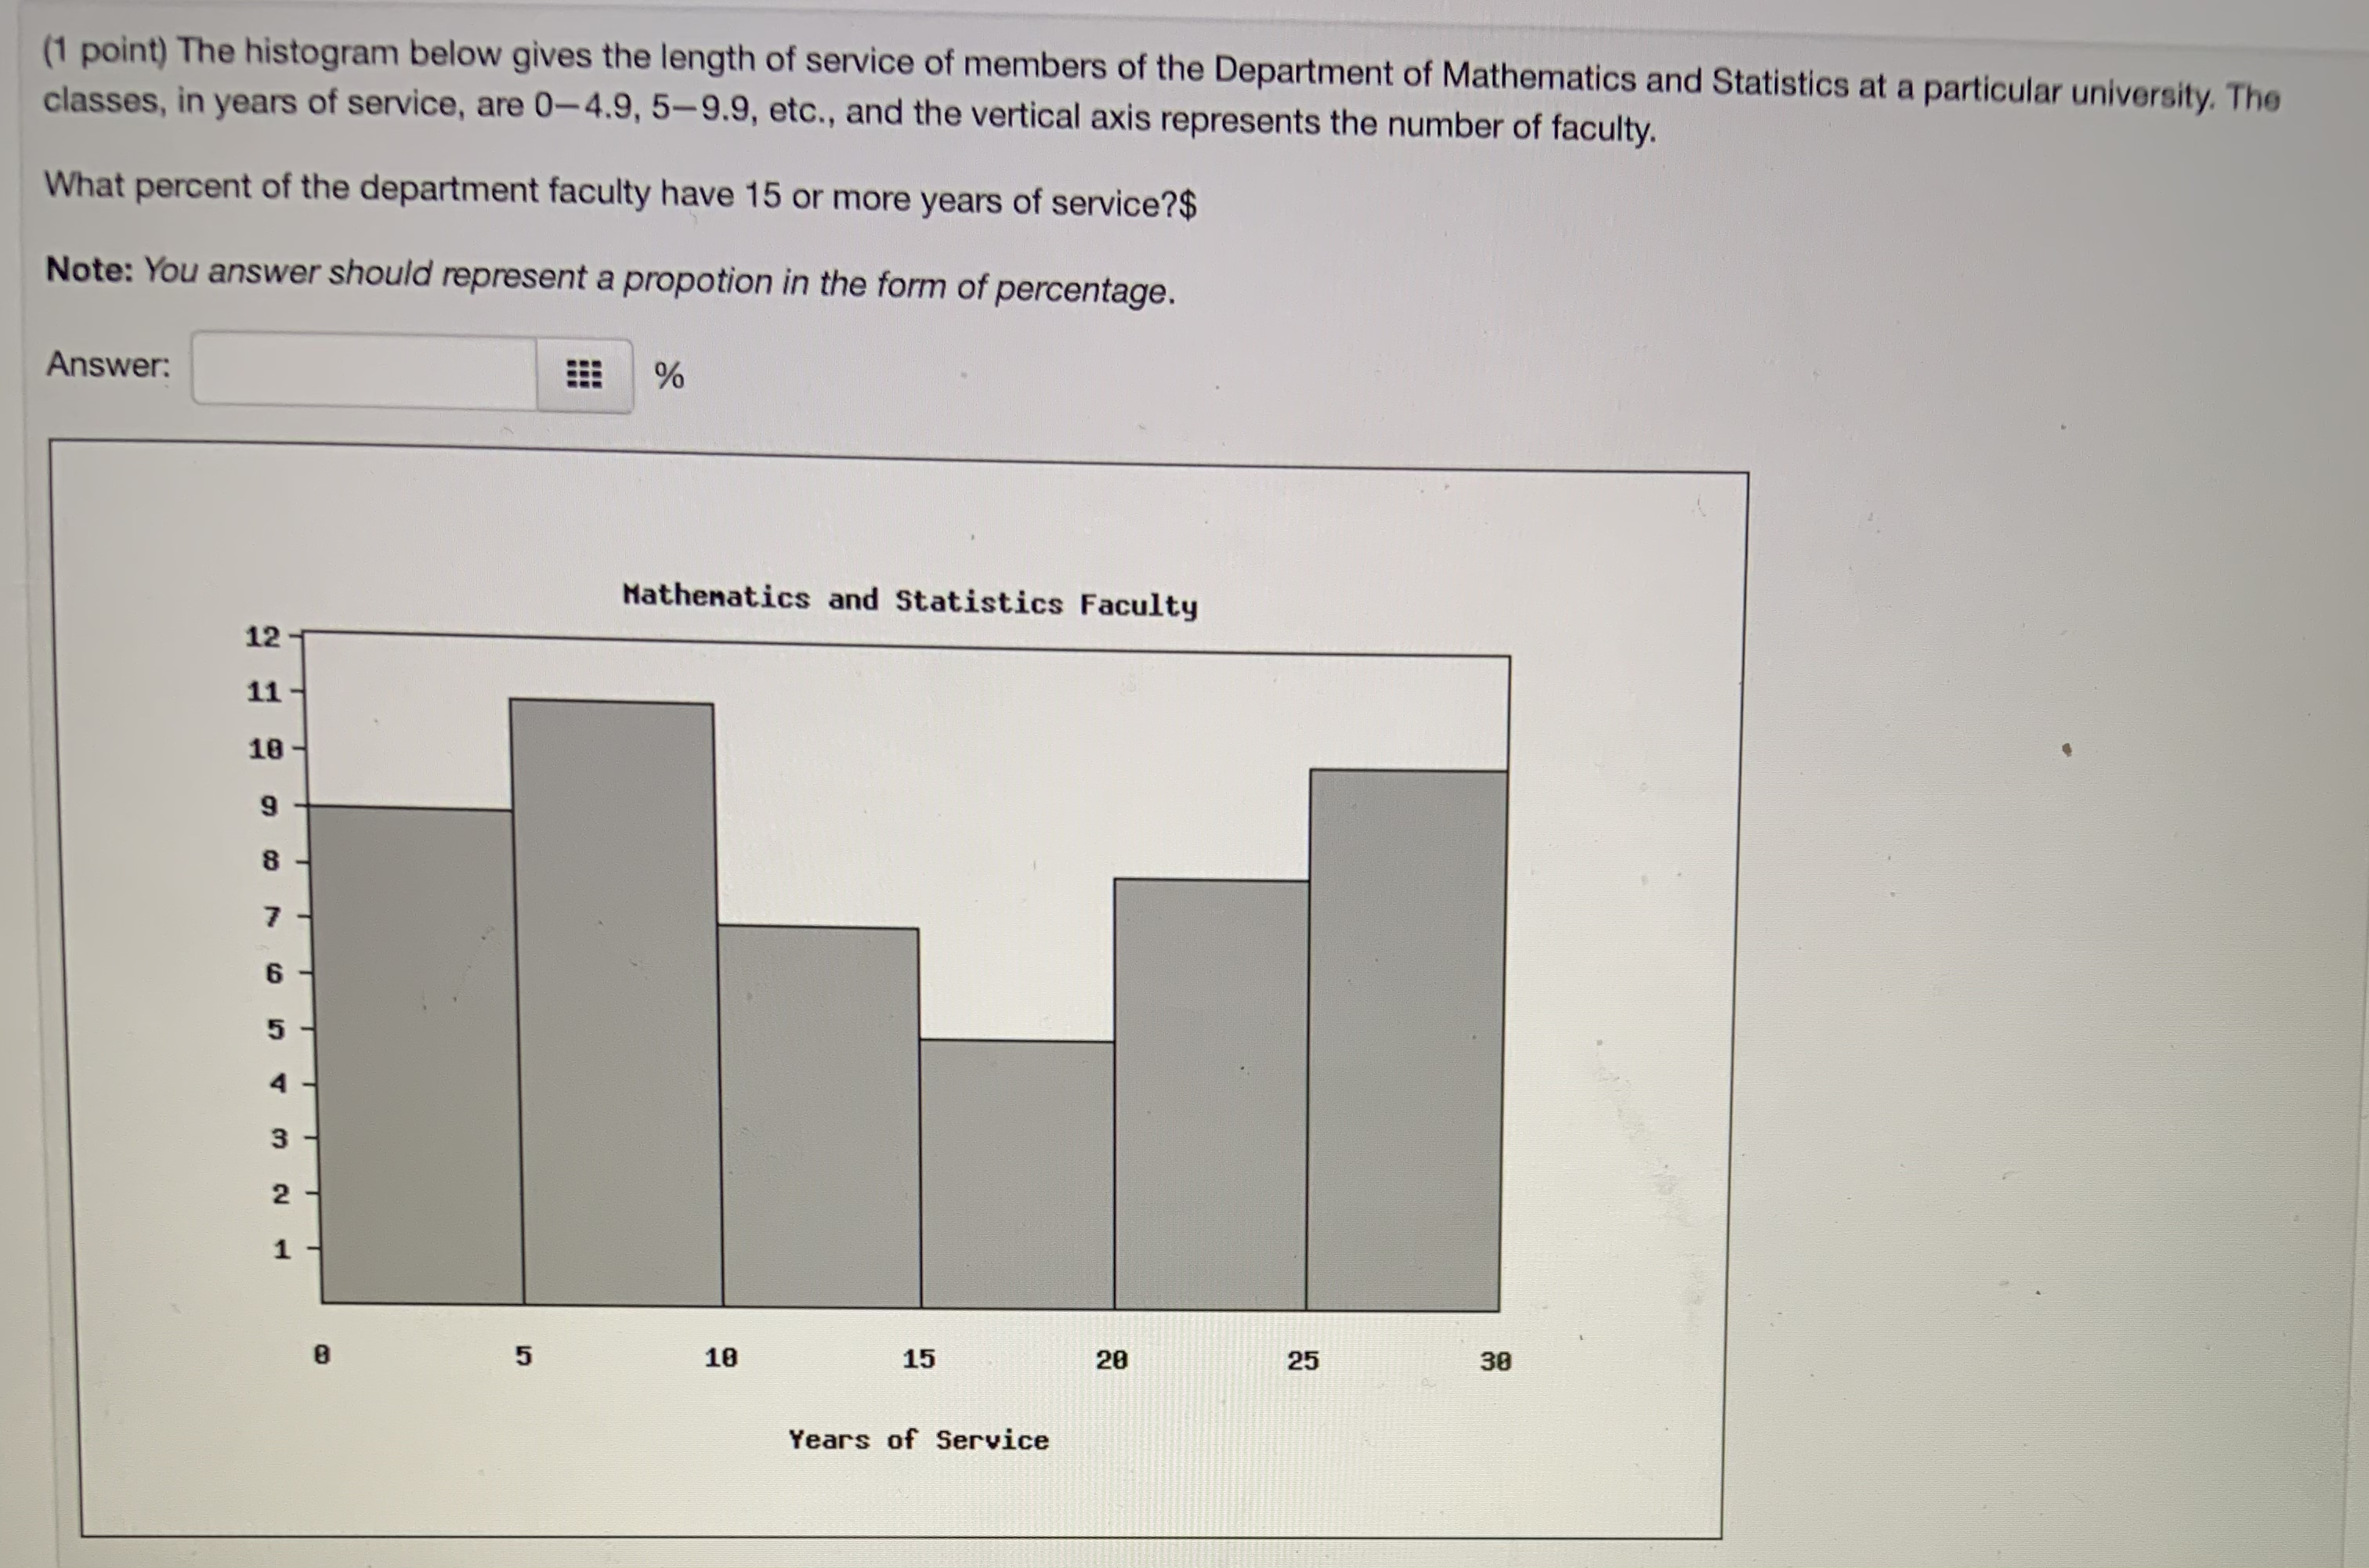
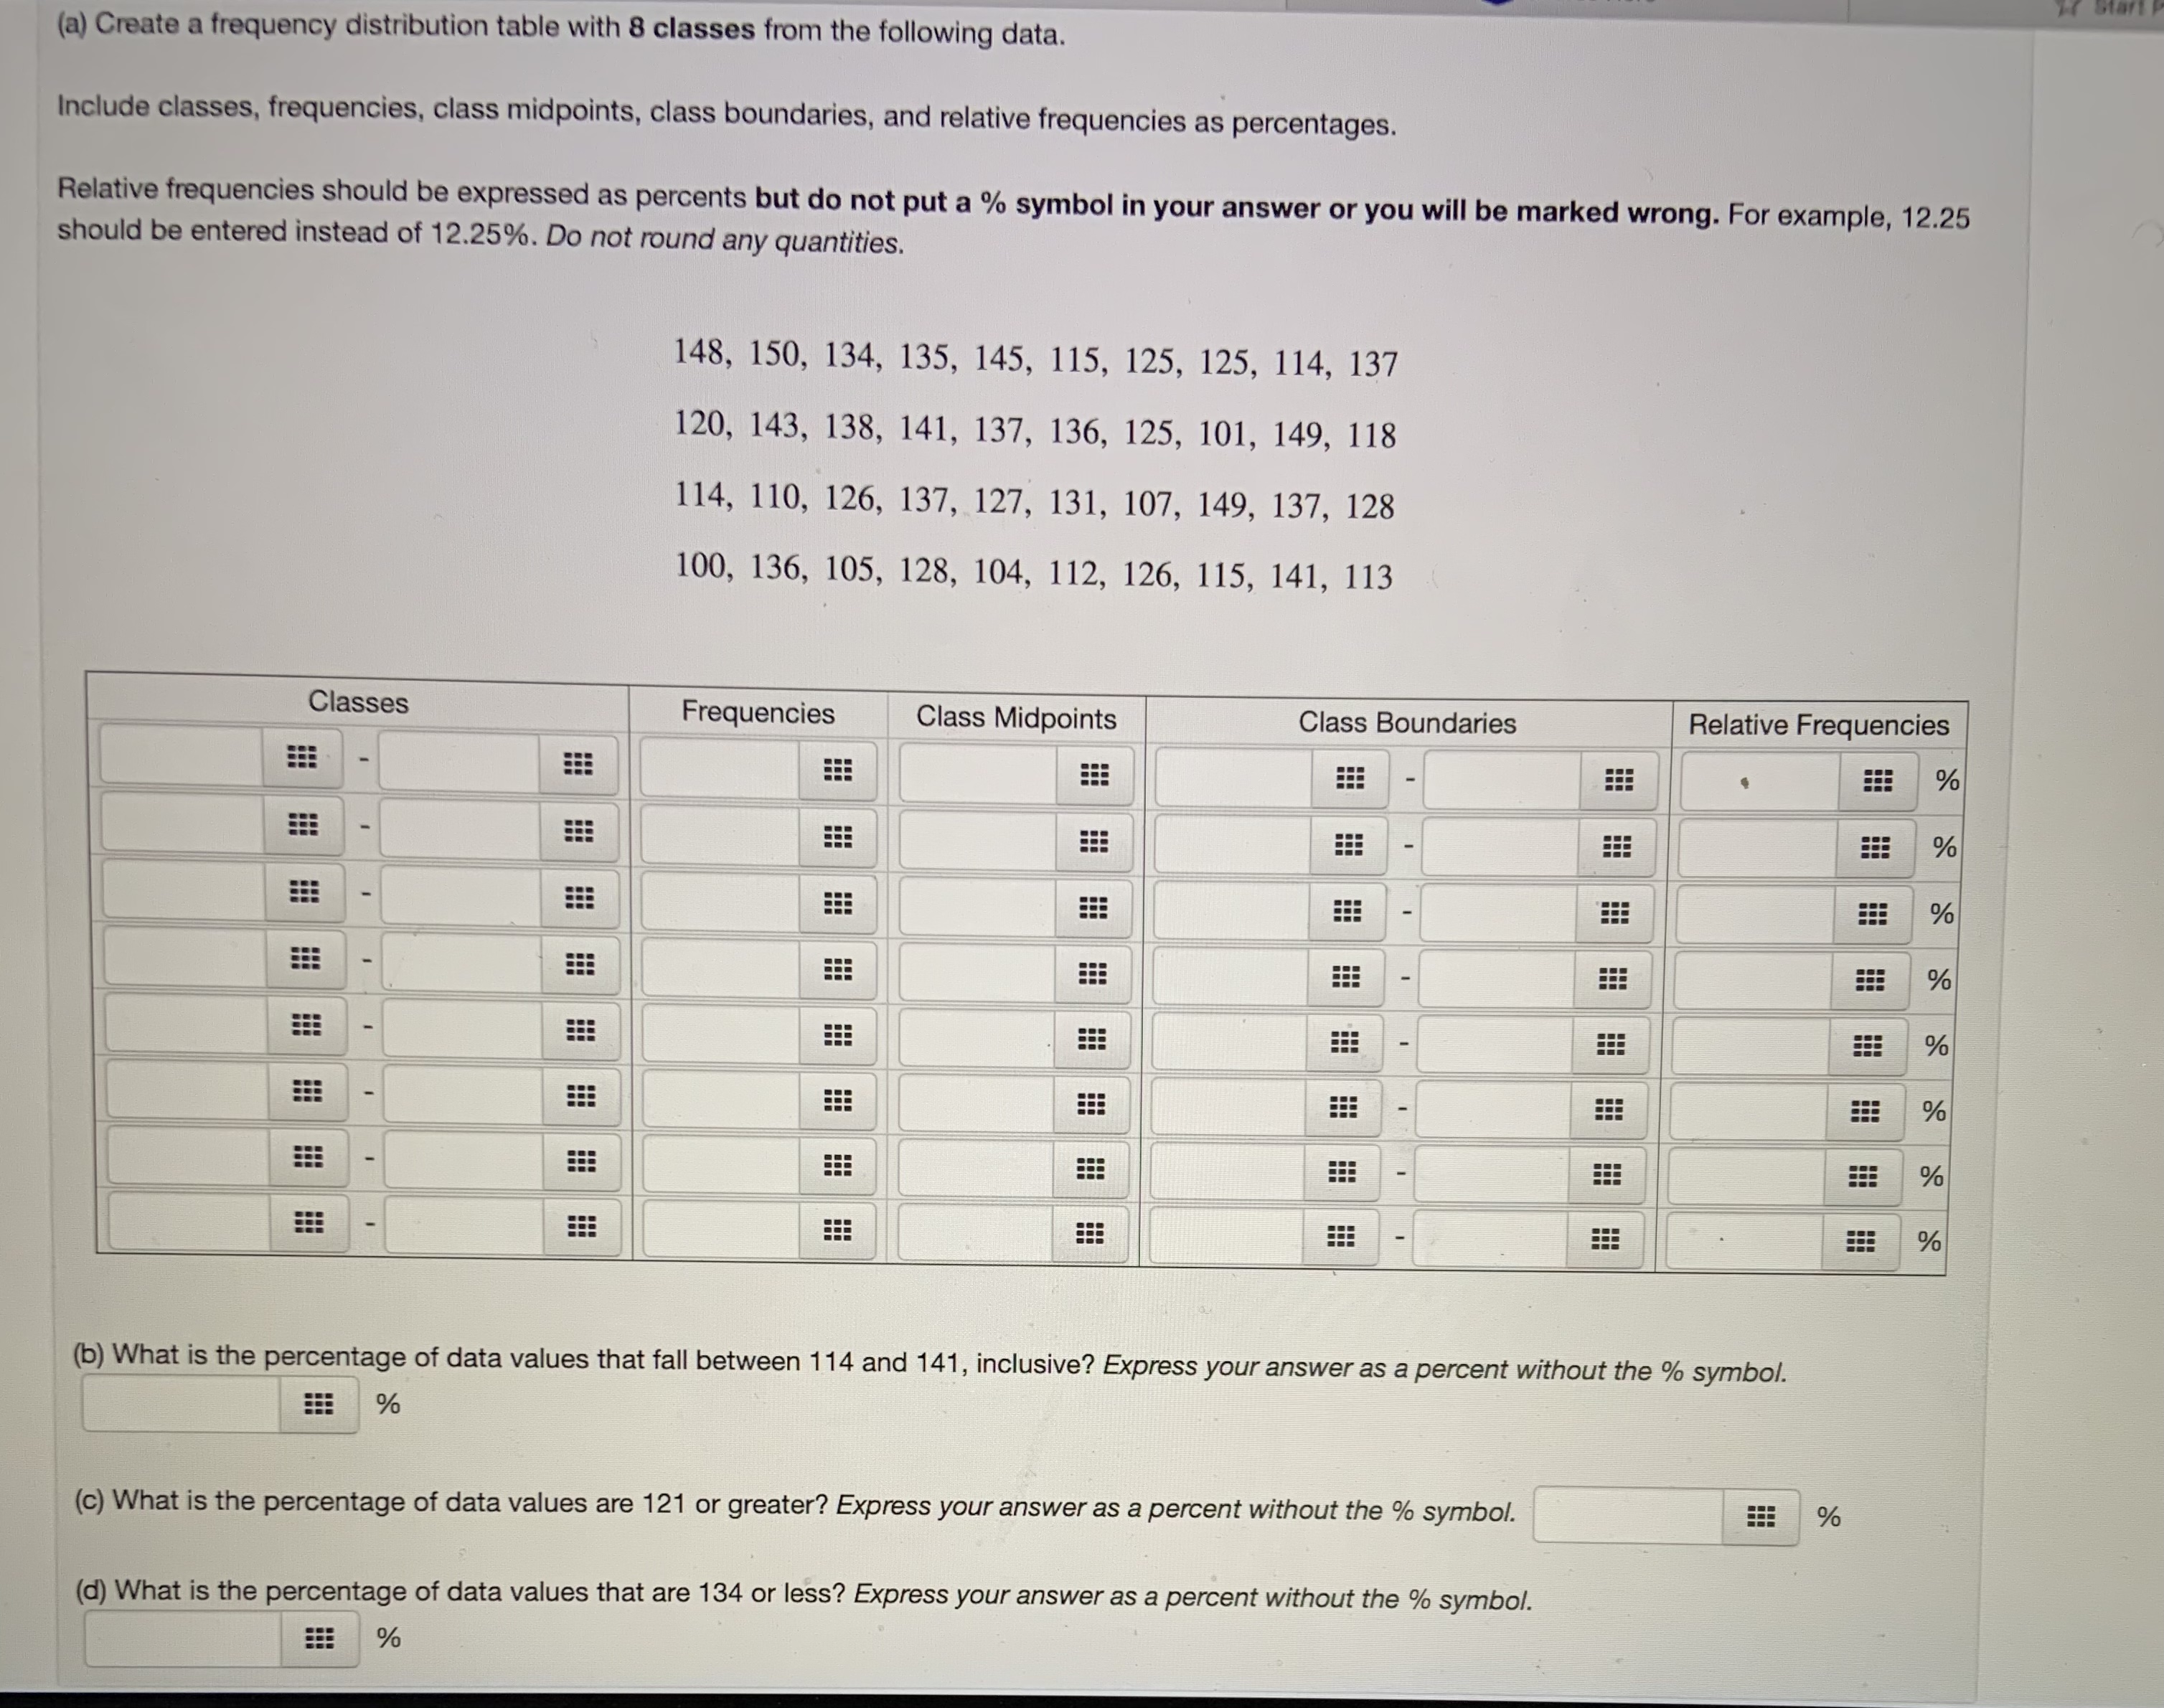
image text in transcribedimage text in transcribed
(1 point) The histogram below gives the length of service of members of the Department of Mathematics and Statistics at a particular university. The classes, in years of service, are 0-4.9, 5-9.9, etc., and the vertical axis represents the number of faculty. What percent of the department faculty have 15 or more years of service?$ Note: You answer should represent a propotion in the form of percentage. Answer: % Mathematics and Statistics Faculty 12 11 18 - W 5 A 16 15 20 25 38 5 Years of Service(a) Create a frequency distribution table with 8 classes from the following data. Include classes, frequencies, class midpoints, class boundaries, and relative frequencies as percentages. Relative frequencies should be expressed as percents but do not put a % symbol in your answer or you will be marked wrong. For example, 12.25 should be entered instead of 12.25%. Do not round any quantities. 148, 150, 134, 135, 145, 115, 125, 125, 114, 137 120, 143, 138, 141, 137, 136, 125, 101, 149, 118 114, 110, 126, 137, 127, 131, 107, 149, 137, 128 100, 136, 105, 128, 104, 112, 126, 115, 141, 113 Classes Frequencies Class Midpoints Class Boundaries Relative Frequencies # % % (b) What is the percentage of data values that fall between 114 and 141, inclusive? Express your answer as a percent without the % symbol. % (c) What is the percentage of data values are 121 or greater? Express your answer as a percent without the % symbol. % 'd) What is the percentage of data values that are 134 or less? Express your answer as a percent without the % symbol. %

Step by Step Solution

There are 3 Steps involved in it

Step: 1

blur-text-image

Get Instant Access to Expert-Tailored Solutions

See step-by-step solutions with expert insights and AI powered tools for academic success

Step: 2

blur-text-image

Step: 3

blur-text-image

Ace Your Homework with AI

Get the answers you need in no time with our AI-driven, step-by-step assistance

Get Started

Recommended Textbook for

Trigonometry, Enhanced

Authors: Cynthia Y Young

4th Edition

1119321131, 9781119321132

More Books

Students also viewed these Mathematics questions