

Question
1. Prepare the financial statements based on the inputs 2. Calculate DSO, DIO and DPO for the historical financials 3. Provide your comments on the
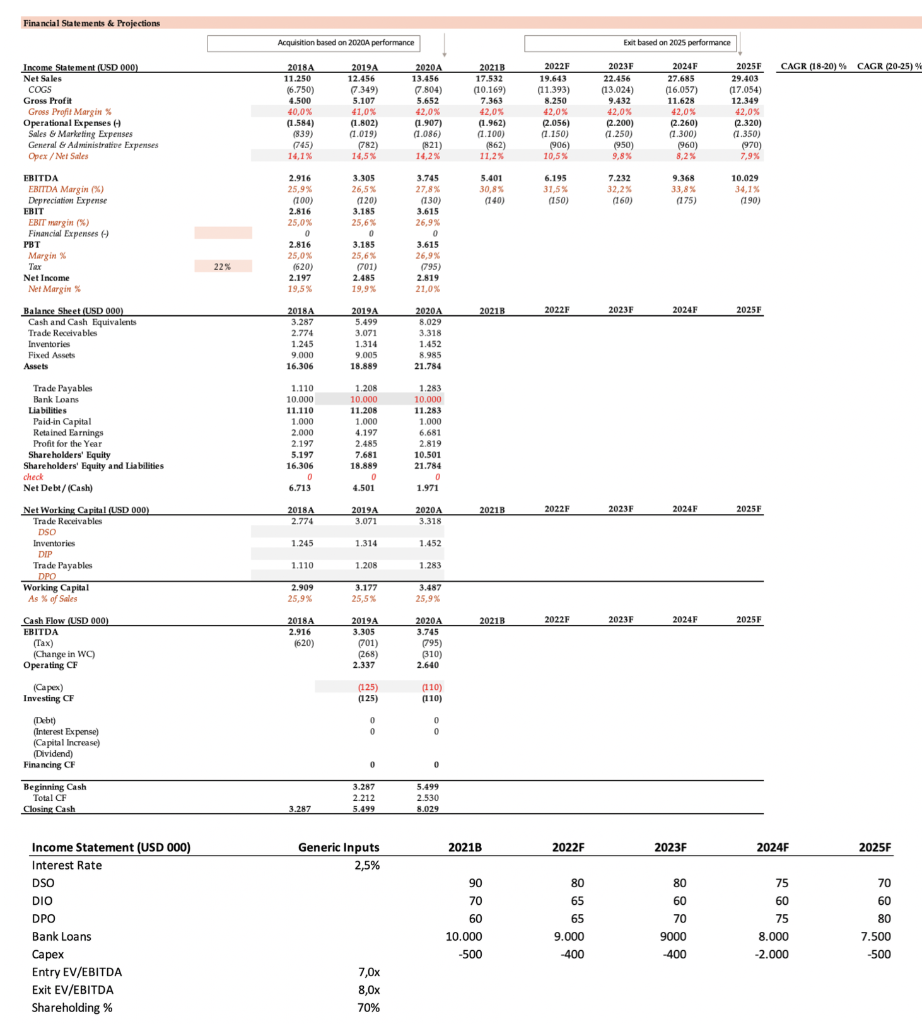
1. Prepare the financial statements based on the inputs
2. Calculate DSO, DIO and DPO for the historical financials
3. Provide your comments on the working capital profile of the Company? What is going on in the projection period?
4. Prepare entry and exit valuation tables for the deal
5. Provide your comments on PE valuation approach in deals. What really matters?
6. Prepare an additional entry valuation table for a potential cash-in deal ($10,000k cash-in). Provide your comments on pre-money and post-money equity value
7. Prepare a cash flow for X MiF fund for the next 5 years, calculate IRR% and MoIC
8. Prepare a value-creation bridge table, comment on where the value creation comes from?
9. Do you recommend that X MiF fund should invest in such a company? Why? If not, what should be changed to make it attractive?
Financial Statements & Projections Income Statement (USD 000) Net Sales COGS Gross Profit Gross Profit Margin % Operational Expenses (-) Sales & Marketing Expenses General & Administrative Expenses Opex/Net Sales EBITDA EBITDA Margin (%) Depreciation Expense EBIT EBIT margin (%) Financial Expenses (-) PBT Margin % Tax Net Income Net Margin % Balance Sheet (USD 000) Cash and Cash Equivalents Trade Receivables Inventories Fixed Assets Trade Payables Bank Loans Liabilities Paid-in Capital Retained Earnings Profit for the Year Shareholders' Equity Shareholders' Equity and Liabilities check Net Debt/(Cash) Net Working Capital (USD 000) Trade Receivables DSO Inventories DIP Trade Payables DPO Working Capital As % of Sales Cash Flow (USD 000) EBITDA (Tax) (Change in WC) Operating CF (Capex) Investing CF (Debt) (Interest Expense) (Capital Increase) (Dividend) Assets Financing CF Beginning Cash Total CF Closing Cash Income Statement (USD 000) Interest Rate DSO DIO DPO Bank Loans Capex Entry EV/EBITDA Exit EV/EBITDA Shareholding % 22% Acquisition based on 2020A performance 2018A 2019A 11.250 (6.750) 4.500 40,0% (1.584) (839) (745) 14,1% 2.916 25,9% (100) 2.816 25,0% 0 2.816 25,0% (620) 2.197 19,5% 2018A 3.287 2.774 1.245 9.000 16.306 1.110 10.000 11.110 1.000 2.000 2.197 5.197 16.306 0 6.713 2018A 2.774 1.245 1.110 2.909 25,9% 2018A 2.916 (620) 12.456 3.287 (7.349) 5.107 41,0% (1.802) (1.019) (782) 14,5% 3.305 26,5% (120) 3.185 25,6% 0 3.185 25,6% (701) 2.485 19,9% 2019A 5.499 3.071 1.314 9.005 18.889 1.208 10.000 11.208 1.000 4.197 2.485 7.681 18.889 0 4.501 2019A 3.071 1.314 1.208 3.177 25,5% 2019A 3.305 (701) (268) 2.337 (125) (125) 0 0 0 3.287 2.212 5.499 Generic Inputs 2,5% 7,0x 8,0x 70% 2020A 13.456 (7.804) 5.652 42,0% (1.907) (1.086) (821) 14,2% 3.745 27,8% (130) 3.615 26,9% 20 3.615 26,9% (795) 2.819 21,0% 2020A 8.029 3.318 1.452 8.985 21.784 1.283 10.000 11.283 1.000 6.681 2.819 10.501 21.784 0 1.971 2020A 3.318 1.452 1.283 3.487 25,9% 2020A 3.745 (795) (310) 2.640 (110) (110) 0 0 0 5.499 2.530 8.029 2021B 17.532 (10.169) 7.363 42,0% (1.962) (1.100) (862) 11,2% 5.401 30,8% (140) 20218 2021B 2021B 2021B 90 70 60 10.000 -500 2022F 19.643 (11.393) 8.250 42,0% (2.056) (1.150) (906) 10,5% 6.195 31,5% (150) 2022F 2022F 2022F 2022F 80 65 65 9.000 -400 Exit based on 2025 performance 2024F 27.685 (16.057) 11.628 42,0% (2.260) (1.300) (960) 8,2% 9.368 33,8% (175) 2024F 2024F 2024F 2023F 22.456 (13.024) 9.432 42,0% (2.200) (1.250) (950) 9,8% 7.232 32,2% (160) 2023F 2023F 2023F 2023F 80 60 70 9000 -400 2025F 29.403 (17.054) 12.349 42,0% (2.320) (1.350) (970) 7,9% 10.029 34,1% (190) 2025F 2025F 2025F CAGR (18-20) % CAGR (20-25) % 2024F 75 60 75 8.000 -2.000 2025F 70 60 80 7.500 -500 Financial Statements & Projections Income Statement (USD 000) Net Sales COGS Gross Profit Gross Profit Margin % Operational Expenses (-) Sales & Marketing Expenses General & Administrative Expenses Opex/Net Sales EBITDA EBITDA Margin (%) Depreciation Expense EBIT EBIT margin (%) Financial Expenses (-) PBT Margin % Tax Net Income Net Margin % Balance Sheet (USD 000) Cash and Cash Equivalents Trade Receivables Inventories Fixed Assets Trade Payables Bank Loans Liabilities Paid-in Capital Retained Earnings Profit for the Year Shareholders' Equity Shareholders' Equity and Liabilities check Net Debt/(Cash) Net Working Capital (USD 000) Trade Receivables DSO Inventories DIP Trade Payables DPO Working Capital As % of Sales Cash Flow (USD 000) EBITDA (Tax) (Change in WC) Operating CF (Capex) Investing CF (Debt) (Interest Expense) (Capital Increase) (Dividend) Assets Financing CF Beginning Cash Total CF Closing Cash Income Statement (USD 000) Interest Rate DSO DIO DPO Bank Loans Capex Entry EV/EBITDA Exit EV/EBITDA Shareholding % 22% Acquisition based on 2020A performance 2018A 2019A 11.250 (6.750) 4.500 40,0% (1.584) (839) (745) 14,1% 2.916 25,9% (100) 2.816 25,0% 0 2.816 25,0% (620) 2.197 19,5% 2018A 3.287 2.774 1.245 9.000 16.306 1.110 10.000 11.110 1.000 2.000 2.197 5.197 16.306 0 6.713 2018A 2.774 1.245 1.110 2.909 25,9% 2018A 2.916 (620) 12.456 3.287 (7.349) 5.107 41,0% (1.802) (1.019) (782) 14,5% 3.305 26,5% (120) 3.185 25,6% 0 3.185 25,6% (701) 2.485 19,9% 2019A 5.499 3.071 1.314 9.005 18.889 1.208 10.000 11.208 1.000 4.197 2.485 7.681 18.889 0 4.501 2019A 3.071 1.314 1.208 3.177 25,5% 2019A 3.305 (701) (268) 2.337 (125) (125) 0 0 0 3.287 2.212 5.499 Generic Inputs 2,5% 7,0x 8,0x 70% 2020A 13.456 (7.804) 5.652 42,0% (1.907) (1.086) (821) 14,2% 3.745 27,8% (130) 3.615 26,9% 20 3.615 26,9% (795) 2.819 21,0% 2020A 8.029 3.318 1.452 8.985 21.784 1.283 10.000 11.283 1.000 6.681 2.819 10.501 21.784 0 1.971 2020A 3.318 1.452 1.283 3.487 25,9% 2020A 3.745 (795) (310) 2.640 (110) (110) 0 0 0 5.499 2.530 8.029 2021B 17.532 (10.169) 7.363 42,0% (1.962) (1.100) (862) 11,2% 5.401 30,8% (140) 20218 2021B 2021B 2021B 90 70 60 10.000 -500 2022F 19.643 (11.393) 8.250 42,0% (2.056) (1.150) (906) 10,5% 6.195 31,5% (150) 2022F 2022F 2022F 2022F 80 65 65 9.000 -400 Exit based on 2025 performance 2024F 27.685 (16.057) 11.628 42,0% (2.260) (1.300) (960) 8,2% 9.368 33,8% (175) 2024F 2024F 2024F 2023F 22.456 (13.024) 9.432 42,0% (2.200) (1.250) (950) 9,8% 7.232 32,2% (160) 2023F 2023F 2023F 2023F 80 60 70 9000 -400 2025F 29.403 (17.054) 12.349 42,0% (2.320) (1.350) (970) 7,9% 10.029 34,1% (190) 2025F 2025F 2025F CAGR (18-20) % CAGR (20-25) % 2024F 75 60 75 8.000 -2.000 2025F 70 60 80 7.500 -500Step by Step Solution
There are 3 Steps involved in it
Step: 1

Get Instant Access to Expert-Tailored Solutions
See step-by-step solutions with expert insights and AI powered tools for academic success
Step: 2

Step: 3
Ace Your Homework with AI
Get the answers you need in no time with our AI-driven, step-by-step assistance
Get Started
Finance for Executives Managing for Value Creation
Authors: Gabriel Hawawini, Claude Viallet
4th edition