Question
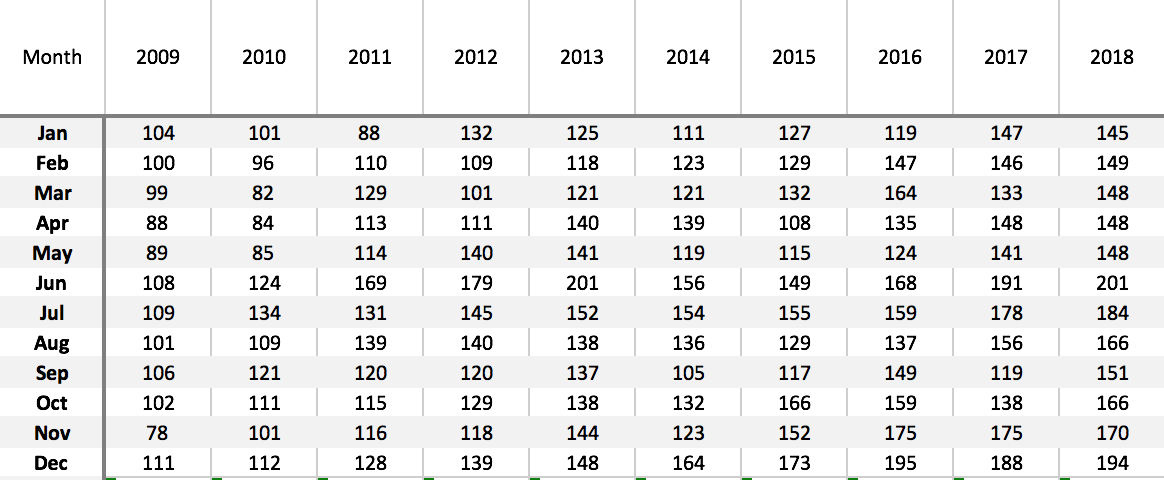
1. Produce a time series plot of the data. From this graph, do you see a pattern? Can you see any seasonality in the data?
1. Produce a time series plot of the data. From this graph, do you see a pattern? Can you see any seasonality in the data? You may have to perform time series plots by years.
2. Use exponential smoothing to fit the data. Select an appropriate constant based on the variation you see in the data. Comment on the appropriateness of exponential smoothing on this data set. Plot the predictions from this model on the graph with the original data. How well does this technique fit the data? Make forecasts for each month in 2019. Remember, for smoothing methods, you can only provide the forecast for the next period. i. If you use ALL 10 years of data (120 data points), that means you are providing a forecast for only Jan 2019. ii. You still need the forecast for the other 11 months. And you cannot do a forecast using the forecasts you are creating for 2019. You will have to figure out how to use all 10 years of data to determine 12 individual, monthly forecasts.
3. Use regression to build a linear trend model. Comment on the goodness-of-fit of this model to the data (or how well does R2 explain the variance in the data?). Plot the predictions from this model on the graph with the original data.
4. Develop multiplicative seasonal indices for the linear trend model developed in question 3. Use these indices to adjust predictions from the linear trend model from question 3 above for seasonal effects. Plot the predictions from this model on the graph with the original data. How well does this technique fit the data? Make forecasts for the next 12 months of 2007 using this technique.
5. Which forecasting method of those that you tried do you have the most confidence for making accurate forecasts for 2019? Use MAPE (mean absolute percent error) as your criterion to justify your decision.

Step by Step Solution
There are 3 Steps involved in it
Step: 1

Get Instant Access to Expert-Tailored Solutions
See step-by-step solutions with expert insights and AI powered tools for academic success
Step: 2

Step: 3

Ace Your Homework with AI
Get the answers you need in no time with our AI-driven, step-by-step assistance
Get Started


