Answered step by step
Verified Expert Solution
Question
1 Approved Answer
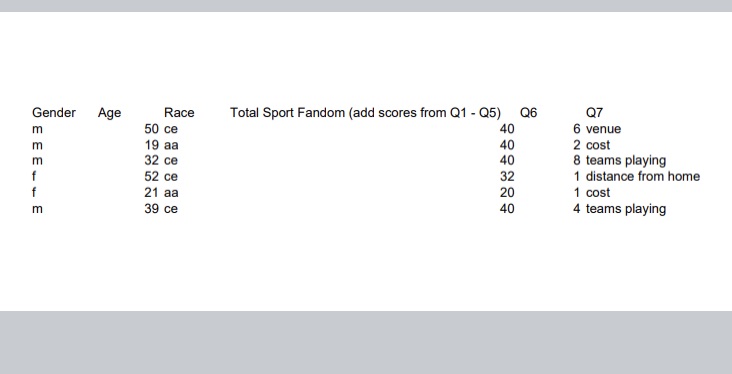
1) Provide demographic statistics to describe your sample. How many men and women? What is the mean age and standard deviation for each?2) Using the
1) Provide demographic statistics to describe your sample. How many men and women? What is the mean age and standard deviation for each?2) Using the appropriate t-test, compare the mean scores between men and woman. Run a similar t-test comparing mean scores.3) First, using the appropriate chi-square test, determine whether men and women differ in their reasons for attendingot attending a game .

Step by Step Solution
There are 3 Steps involved in it
Step: 1

Get Instant Access to Expert-Tailored Solutions
See step-by-step solutions with expert insights and AI powered tools for academic success
Step: 2

Step: 3

Ace Your Homework with AI
Get the answers you need in no time with our AI-driven, step-by-step assistance
Get Started


