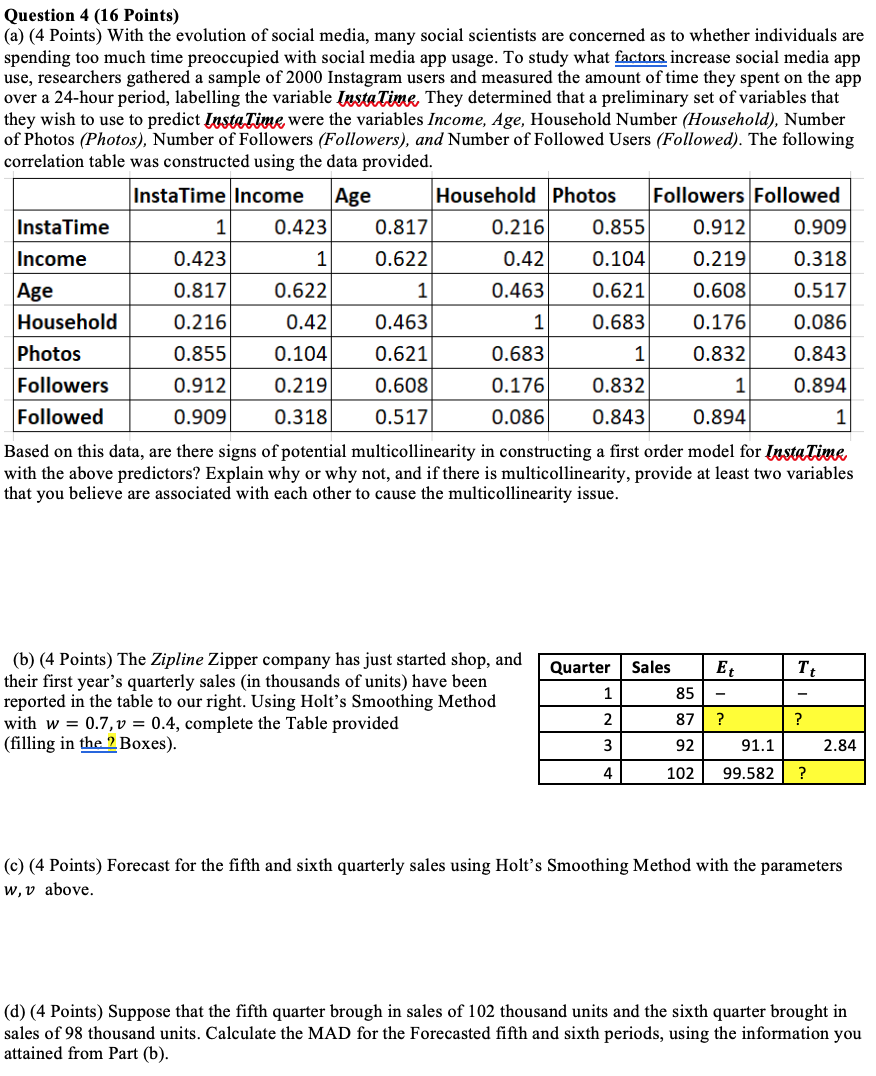
1 Question 4 (16 Points) (a) (4 Points) With the evolution of social media, many social scientists are concerned as to whether individuals are spending too much time preoccupied with social media app usage. To study what factors increase social media app use, researchers gathered a sample of 2000 Instagram users and measured the amount of time they spent on the app over a 24-hour period, labelling the variable InstaTime. They determined that a preliminary set of variables that they wish to use to predict InstaTime were the variables Income, Age, Household Number (Household), Number of Photos (Photos), Number of Followers (Followers), and Number of Followed Users (Followed). The following correlation table was constructed using the data provided. InstaTime Income Age Household Photos Followers Followed InstaTime 0.423 0.817 0.216 0.855 0.912 0.909 Income 0.423 1 0.622 0.42 0.104 0.219 0.318 Age 0.817 0.622 0.463 0.621 0.608 0.517 Household 0.216 0.42 0.463 1 0.683 0.176 0.086 Photos 0.855 0.104 0.621 0.683 1 0.832 0.843 Followers 0.912 0.219 0.608 0.176 0.832 1 0.894 Followed 0.909 0.318 0.517 0.086 0.843 0.894 Based on this data, are there signs of potential multicollinearity in constructing a first order model for InstaTime with the above predictors? Explain why or why not, and if there is multicollinearity, provide at least two variables that you believe are associated with each other to cause the multicollinearity issue. Ho 1 Quarter Et Tt Sales 85 1 - (b) (4 Points) The Zipline Zipper company has just started shop, and their first year's quarterly sales (in thousands of units) have been reported in the table to our right. Using Holt's Smoothing Method with w = 0.7, v = 0.4, complete the Table provided (filling in the 2 Boxes). 2 87 ? ? 3 92 91.1 2.84 4 102 99.582 ? (c) (4 Points) Forecast for the fifth and sixth quarterly sales using Holt's Smoothing Method with the parameters W, v above. (d) (4 Points) Suppose that the fifth quarter brough in sales of 102 thousand units and the sixth quarter brought in sales of 98 thousand units. Calculate the MAD for the Forecasted fifth and sixth periods, using the information you attained from Part (b). 1 Question 4 (16 Points) (a) (4 Points) With the evolution of social media, many social scientists are concerned as to whether individuals are spending too much time preoccupied with social media app usage. To study what factors increase social media app use, researchers gathered a sample of 2000 Instagram users and measured the amount of time they spent on the app over a 24-hour period, labelling the variable InstaTime. They determined that a preliminary set of variables that they wish to use to predict InstaTime were the variables Income, Age, Household Number (Household), Number of Photos (Photos), Number of Followers (Followers), and Number of Followed Users (Followed). The following correlation table was constructed using the data provided. InstaTime Income Age Household Photos Followers Followed InstaTime 0.423 0.817 0.216 0.855 0.912 0.909 Income 0.423 1 0.622 0.42 0.104 0.219 0.318 Age 0.817 0.622 0.463 0.621 0.608 0.517 Household 0.216 0.42 0.463 1 0.683 0.176 0.086 Photos 0.855 0.104 0.621 0.683 1 0.832 0.843 Followers 0.912 0.219 0.608 0.176 0.832 1 0.894 Followed 0.909 0.318 0.517 0.086 0.843 0.894 Based on this data, are there signs of potential multicollinearity in constructing a first order model for InstaTime with the above predictors? Explain why or why not, and if there is multicollinearity, provide at least two variables that you believe are associated with each other to cause the multicollinearity issue. Ho 1 Quarter Et Tt Sales 85 1 - (b) (4 Points) The Zipline Zipper company has just started shop, and their first year's quarterly sales (in thousands of units) have been reported in the table to our right. Using Holt's Smoothing Method with w = 0.7, v = 0.4, complete the Table provided (filling in the 2 Boxes). 2 87 ? ? 3 92 91.1 2.84 4 102 99.582 ? (c) (4 Points) Forecast for the fifth and sixth quarterly sales using Holt's Smoothing Method with the parameters W, v above. (d) (4 Points) Suppose that the fifth quarter brough in sales of 102 thousand units and the sixth quarter brought in sales of 98 thousand units. Calculate the MAD for the Forecasted fifth and sixth periods, using the information you attained from Part (b)