Answered step by step
Verified Expert Solution
Question
1 Approved Answer
1. Review Amazons capital structure and explain whether it is in alignment/supports its value proposition/current stage of development/cash flow characteristics of the business. Are there
1. Review Amazons capital structure and explain whether it is in alignment/supports its value proposition/current stage of development/cash flow characteristics of the business. Are there any changes that you make that could potentially add value?
2. Review Amazons cash flow generation and how it has either allocated excess cash flow (dividends/share repurchases, acquisitions) or financed is cash flow deficit. Are there any changes that you would suggest and why? What has been the trend in working capital usage and capital spending over time?
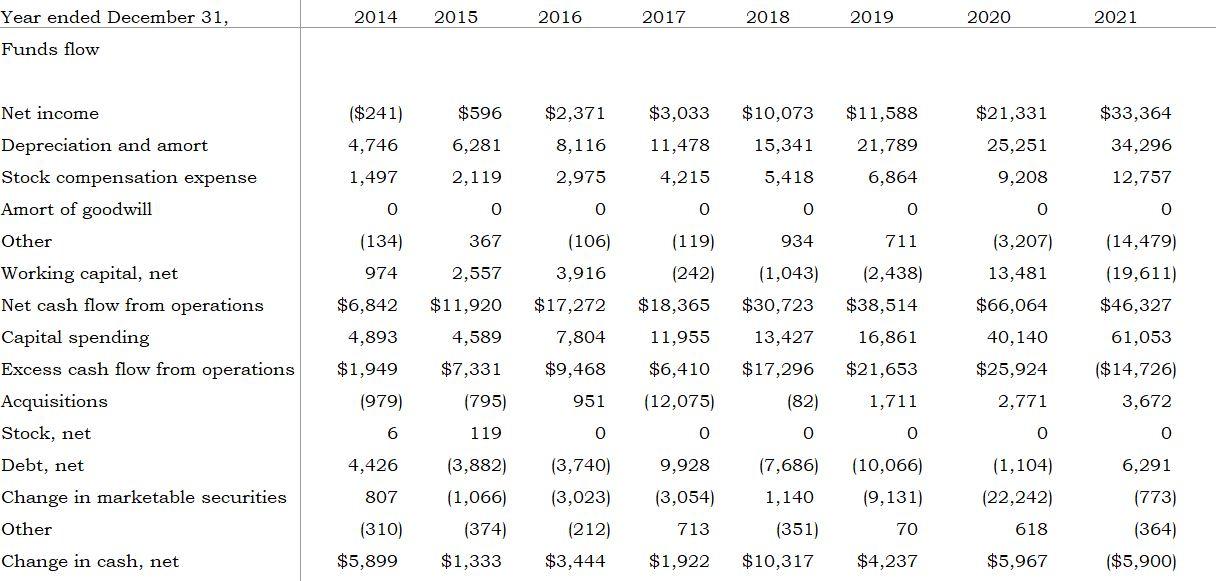
Year ended December 31, Funds flow Net income Depreciation and amort Stock compensation expense Amort of goodwill Other Working capital, net Net cash flow from operations Capital spending Excess cash flow from operations Acquisitions Stock, net Debt, net Change in marketable securities Other Change in cash, net. 2018 2019 $596 $2,371 $3,033 $10,073 $11,588 6,281 8,116 11,478 15,341 21,789 2,119 2,975 4,215 5,418 6,864 0 0 0 0 367 (106) (119) 934 711 2,557 3,916 (242) (1,043) (2,438) $11,920 $17,272 $18,365 $30,723 $38,514 4,589 7,804 13,427 16,861 11,955 $6,410 $17,296 $7,331 $9,468 $21,653 951 (12,075) (82) 1,711 0 0 0 0 (3,740) (7,686) (10,066) 9,928 (3,054) (3,023) (9,131) 1,140 (351) (212) 713 70 $3,444 $1,922 $10,317 $4,237 2014 2015 ($241) 4,746 1,497 (134) 974 $6,842 4,893 $1,949 (979) (795) 6 119 4,426 (3,882) 807 (1,066) (310) (374) $5,899 $1,333 2016 2017 2020 $21,331 25,251 9,208 0 (3,207) 13,481 $66,064 40,140 $25,924 2,771 0 (1,104) (22,242) 618 $5,967 2021 $33,364 34,296 12,757 0 (14,479) (19,611) $46,327 61,053 ($14,726) 3,672 0 6,291 (773) (364) ($5,900) Year ended December 31, Funds flow Net income Depreciation and amort Stock compensation expense Amort of goodwill Other Working capital, net Net cash flow from operations Capital spending Excess cash flow from operations Acquisitions Stock, net Debt, net Change in marketable securities Other Change in cash, net. 2018 2019 $596 $2,371 $3,033 $10,073 $11,588 6,281 8,116 11,478 15,341 21,789 2,119 2,975 4,215 5,418 6,864 0 0 0 0 367 (106) (119) 934 711 2,557 3,916 (242) (1,043) (2,438) $11,920 $17,272 $18,365 $30,723 $38,514 4,589 7,804 13,427 16,861 11,955 $6,410 $17,296 $7,331 $9,468 $21,653 951 (12,075) (82) 1,711 0 0 0 0 (3,740) (7,686) (10,066) 9,928 (3,054) (3,023) (9,131) 1,140 (351) (212) 713 70 $3,444 $1,922 $10,317 $4,237 2014 2015 ($241) 4,746 1,497 (134) 974 $6,842 4,893 $1,949 (979) (795) 6 119 4,426 (3,882) 807 (1,066) (310) (374) $5,899 $1,333 2016 2017 2020 $21,331 25,251 9,208 0 (3,207) 13,481 $66,064 40,140 $25,924 2,771 0 (1,104) (22,242) 618 $5,967 2021 $33,364 34,296 12,757 0 (14,479) (19,611) $46,327 61,053 ($14,726) 3,672 0 6,291 (773) (364) ($5,900)Step by Step Solution
There are 3 Steps involved in it
Step: 1
Get Instant Access to Expert-Tailored Solutions
See step-by-step solutions with expert insights and AI powered tools for academic success
Step: 2
Step: 3
Ace Your Homework with AI
Get the answers you need in no time with our AI-driven, step-by-step assistance
Get Started