

Question
1. Review the trends reflected in the provided financial statements. Comment on any areas of significant decline or improvement that may give an indication of
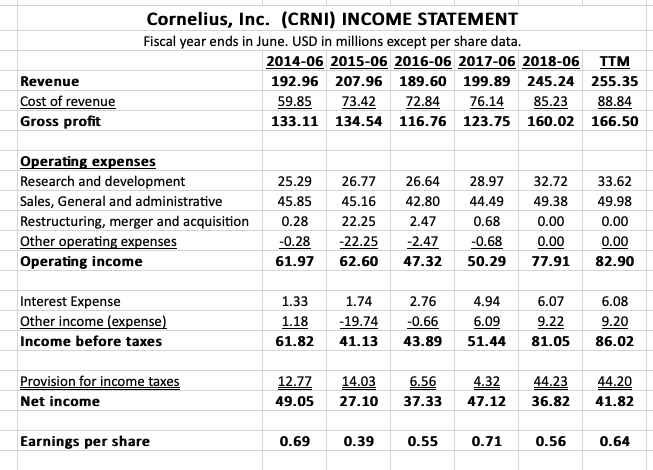
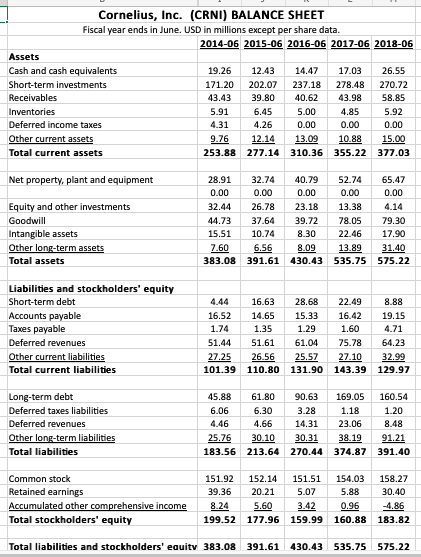
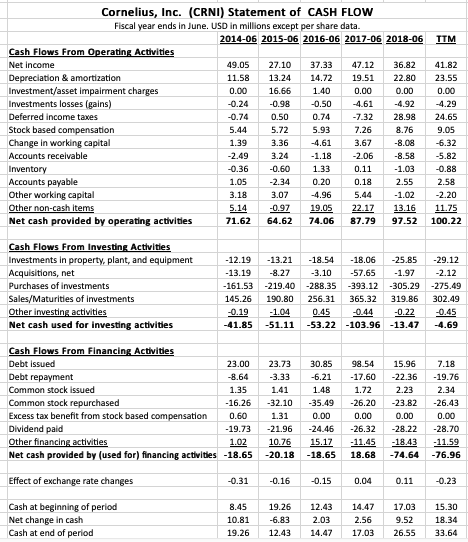
1. Review the trends reflected in the provided financial statements. Comment on any areas of significant decline or improvement that may give an indication of the companys performance trend.
Cornelius, Inc. (CRNI) INCOME STATEMENT Fiscal year ends in June. USD in millions except per share data. 2014-06 2015-06 2016-06 2017-06 2018-06 TTM 192.96 207.96 189.60 199.89 245.24 255.35 59.85 73.42 72.84 76.14 85.23 88.84 133.11 134.54 116.76 123.75 160.02 166.50 Revenue Cost of revenue Gross profit Operating expenses Research and development Sales, General and administrative Restructuring, merger and acquisition Other operating expenses Operating income 25.29 45.85 0.28 -0.28 61.97 26.77 45.16 22.25 -22.25 62.60 26.64 42.80 2.47 -2.47 47.32 28.97 44.49 0.68 -0.68 50.29 32.72 49.38 0.00 0.00 77.91 33.62 49.98 0.00 0.00 82.90 Interest Expense Other income (expense) Income before taxes 1.33 1.18 61.82 1.74 -19.74 41.13 wa 2.76 -0.66 43.89 4.94 6.09 51.44 . 6.07 9.22 81.05 6.08 9.20 86.02 4.32 Provision for income taxes Net income 12.77 49.05 14.03 27.10 6.56 37.33 44.23 36.82 44.20 41.82 47.12 Earnings per share 0.69 0.39 0.55 0.71 0.56 0.64 Cornelius, Inc. (CRNI) BALANCE SHEET Fiscal year ends in June. USD in millions except per share data. 2014-06 2015-06 2016-06 2017-06 2018-06 Assets Cash and cash equivalents 19.26 12.43 14.47 17.03 26.55 Short-term investments 171.20 202.07 237.18 278.48 270.72 Receivables 43.43 39.80 40.62 43.98 58.85 Inventories 5.91 6.45 5.00 4.85 5.92 Deferred income taxes 4.31 4.26 0.00 0.00 Other current assets 9.76 12.14 13.09 10.88 15.00 Total current assets 253.88 277.14 310.36 355.22 377.03 0.00 Net property, plant and equipment Equity and other investments Goodwill Intangible assets Other long-term assets Total assets 28.91 32.74 40.79 52.74 65.47 0.00 0.00 0.00 0.00 0.00 32.44 26.78 23.18 13.38 4.14 44.73 37.64 39.72 78.05 79.30 15.51 10.74 22.46 17.90 7.60 6.56 8.09 13.89 31.40 383.08 391.61 430.43 535.75 575.22 8.30 Liabilities and stockholders' equity Short-term debt Accounts payable Taxes payable Deferred revenues Other current liabilities Total current liabilities 4.44 16.63 16.52 14.65 1.74 1.35 51.44 51.61 27.25 26.56 101.39 110.80 28.68 22.49 15.33 16.42 1.29 1.60 61.04 75.78 25.57 27.10 131.90 143.39 8.88 19.15 4.71 64.23 32.99 129.97 Long-term debt Deferred taxes liabilities Deferred revenues Other long-term liabilities Total liabilities 45.88 61.80 90.63 169.05 160.54 6.06 6.30 3.28 1.18 1.20 4.46 4.66 14.31 23.06 8.48 25.76 30.10 30.31 38.19 91.21 183.56 213.64 270.44 374.87 391.40 Common stock Retained earnings Accumulated other comprehensive income Total stockholders' equity 151.92 152.14 39.36 20.21 8.24 5.60 199.52 177.96 151.51 154.03 158.27 5.07 5.88 30.40 3.42 0.96 -4.86 159.99 160.88 183.82 Total liabilities and stockholders' equity 383.08 391.61 430.43 535.75 575.22 TIM 41.82 23.55 0.00 -4.29 24.65 9.05 -6.32 -5.82 -0.88 2.58 -2.20 11.75 100.22 Cornelius, Inc. (CRNI) Statement of CASH FLOW Fiscal year ends in June. USD in millions except per share data. 2014-06 2015-06 2016-06 2017-06 2018-06 Cash Flows From Operating Activities Net Income 49.05 27.10 37.33 47.12 36.82 Depreciation & amortization 11.58 13.24 14.72 19.51 22.80 Investment/asset impairment charges 0.00 16.66 1.40 0.00 0.00 Investments losses (gains) -0.24 -0.98 -0.50 -4.61 -4.92 Deferred Income taxes -0.74 0.50 0.74 -7.32 28.98 Stock based compensation 5.44 5.72 5.93 7.26 8.76 Change in working capital 1.39 3.36 -4.61 3.67 -8.08 Accounts receivable -2.49 3.24 -1.18 -2.06 -8.58 Inventory -0.36 -0.60 1.33 0.11 -1.03 Accounts payable 1.05 -2.34 0.20 0.18 2.55 Other working capital 3.18 3.07 -4.96 5.44 -1.02 Other non-cash items 5.14 -0.97 19.05 22.17 13.16 Net cash provided by operating activities 71.62 64.62 74.06 87.79 97.52 Cash Flows From Investing Activities Investments in property, plant, and equipment - 12.19 -13.21 -18.54 -18.06 -25.85 Acquisitions, net -13.19 -8.27 -3.10 -57.65 -1.97 Purchases of investments -161.53 -219.40 -288.35 -393.12 -305.29 Sales/Maturities of investments 145.26 190.80 256.31 365.32 319.86 Other investing activities -0.19 -1.04 0.45 -0.44 -0.22 Net cash used for investing activities -41.85 -51.11 -53.22 -103.96 -13.47 Cash Flows From Financing Activities Debt issued 23.00 23.73 30.85 98.54 15.96 Debt repayment -8.64 -3.33 -6.21 -17.60 -22.36 Common stock issued 1.35 1.41 1.48 1.72 2.23 Common stock repurchased -16.26 -32.10 -35.49 -26.20 -23.82 Excess tax benefit from stock based compensation 0.60 1.31 0.00 0.00 0.00 Dividend paid -19.73 -21.96 -24.46 -26.32 -28.22 Other financing activities 1.02 10.76 15.17 - 11.45 -18.43 Net cash provided by (used for) financing activities -18.65 -20.18 -18.65 18.68 -74.64 -29.12 -2.12 -275.49 302.49 -0.45 -4.69 7.18 -19.76 2.34 -26.43 0.00 -28.70 -11.59 -76.96 -0.31 -0.16 -0.15 0.04 0.11 -0.23 Effect of exchange rate changes Cash at beginning of period Net change in cash Cash at end of period 8.45 10.81 19.26 19.26 -6.83 12.43 12.43 2.03 14.47 14.47 2.56 17.03 17.03 9.52 26.55 15.30 18.34 33.64 Cornelius, Inc. (CRNI) INCOME STATEMENT Fiscal year ends in June. USD in millions except per share data. 2014-06 2015-06 2016-06 2017-06 2018-06 TTM 192.96 207.96 189.60 199.89 245.24 255.35 59.85 73.42 72.84 76.14 85.23 88.84 133.11 134.54 116.76 123.75 160.02 166.50 Revenue Cost of revenue Gross profit Operating expenses Research and development Sales, General and administrative Restructuring, merger and acquisition Other operating expenses Operating income 25.29 45.85 0.28 -0.28 61.97 26.77 45.16 22.25 -22.25 62.60 26.64 42.80 2.47 -2.47 47.32 28.97 44.49 0.68 -0.68 50.29 32.72 49.38 0.00 0.00 77.91 33.62 49.98 0.00 0.00 82.90 Interest Expense Other income (expense) Income before taxes 1.33 1.18 61.82 1.74 -19.74 41.13 wa 2.76 -0.66 43.89 4.94 6.09 51.44 . 6.07 9.22 81.05 6.08 9.20 86.02 4.32 Provision for income taxes Net income 12.77 49.05 14.03 27.10 6.56 37.33 44.23 36.82 44.20 41.82 47.12 Earnings per share 0.69 0.39 0.55 0.71 0.56 0.64 Cornelius, Inc. (CRNI) BALANCE SHEET Fiscal year ends in June. USD in millions except per share data. 2014-06 2015-06 2016-06 2017-06 2018-06 Assets Cash and cash equivalents 19.26 12.43 14.47 17.03 26.55 Short-term investments 171.20 202.07 237.18 278.48 270.72 Receivables 43.43 39.80 40.62 43.98 58.85 Inventories 5.91 6.45 5.00 4.85 5.92 Deferred income taxes 4.31 4.26 0.00 0.00 Other current assets 9.76 12.14 13.09 10.88 15.00 Total current assets 253.88 277.14 310.36 355.22 377.03 0.00 Net property, plant and equipment Equity and other investments Goodwill Intangible assets Other long-term assets Total assets 28.91 32.74 40.79 52.74 65.47 0.00 0.00 0.00 0.00 0.00 32.44 26.78 23.18 13.38 4.14 44.73 37.64 39.72 78.05 79.30 15.51 10.74 22.46 17.90 7.60 6.56 8.09 13.89 31.40 383.08 391.61 430.43 535.75 575.22 8.30 Liabilities and stockholders' equity Short-term debt Accounts payable Taxes payable Deferred revenues Other current liabilities Total current liabilities 4.44 16.63 16.52 14.65 1.74 1.35 51.44 51.61 27.25 26.56 101.39 110.80 28.68 22.49 15.33 16.42 1.29 1.60 61.04 75.78 25.57 27.10 131.90 143.39 8.88 19.15 4.71 64.23 32.99 129.97 Long-term debt Deferred taxes liabilities Deferred revenues Other long-term liabilities Total liabilities 45.88 61.80 90.63 169.05 160.54 6.06 6.30 3.28 1.18 1.20 4.46 4.66 14.31 23.06 8.48 25.76 30.10 30.31 38.19 91.21 183.56 213.64 270.44 374.87 391.40 Common stock Retained earnings Accumulated other comprehensive income Total stockholders' equity 151.92 152.14 39.36 20.21 8.24 5.60 199.52 177.96 151.51 154.03 158.27 5.07 5.88 30.40 3.42 0.96 -4.86 159.99 160.88 183.82 Total liabilities and stockholders' equity 383.08 391.61 430.43 535.75 575.22 TIM 41.82 23.55 0.00 -4.29 24.65 9.05 -6.32 -5.82 -0.88 2.58 -2.20 11.75 100.22 Cornelius, Inc. (CRNI) Statement of CASH FLOW Fiscal year ends in June. USD in millions except per share data. 2014-06 2015-06 2016-06 2017-06 2018-06 Cash Flows From Operating Activities Net Income 49.05 27.10 37.33 47.12 36.82 Depreciation & amortization 11.58 13.24 14.72 19.51 22.80 Investment/asset impairment charges 0.00 16.66 1.40 0.00 0.00 Investments losses (gains) -0.24 -0.98 -0.50 -4.61 -4.92 Deferred Income taxes -0.74 0.50 0.74 -7.32 28.98 Stock based compensation 5.44 5.72 5.93 7.26 8.76 Change in working capital 1.39 3.36 -4.61 3.67 -8.08 Accounts receivable -2.49 3.24 -1.18 -2.06 -8.58 Inventory -0.36 -0.60 1.33 0.11 -1.03 Accounts payable 1.05 -2.34 0.20 0.18 2.55 Other working capital 3.18 3.07 -4.96 5.44 -1.02 Other non-cash items 5.14 -0.97 19.05 22.17 13.16 Net cash provided by operating activities 71.62 64.62 74.06 87.79 97.52 Cash Flows From Investing Activities Investments in property, plant, and equipment - 12.19 -13.21 -18.54 -18.06 -25.85 Acquisitions, net -13.19 -8.27 -3.10 -57.65 -1.97 Purchases of investments -161.53 -219.40 -288.35 -393.12 -305.29 Sales/Maturities of investments 145.26 190.80 256.31 365.32 319.86 Other investing activities -0.19 -1.04 0.45 -0.44 -0.22 Net cash used for investing activities -41.85 -51.11 -53.22 -103.96 -13.47 Cash Flows From Financing Activities Debt issued 23.00 23.73 30.85 98.54 15.96 Debt repayment -8.64 -3.33 -6.21 -17.60 -22.36 Common stock issued 1.35 1.41 1.48 1.72 2.23 Common stock repurchased -16.26 -32.10 -35.49 -26.20 -23.82 Excess tax benefit from stock based compensation 0.60 1.31 0.00 0.00 0.00 Dividend paid -19.73 -21.96 -24.46 -26.32 -28.22 Other financing activities 1.02 10.76 15.17 - 11.45 -18.43 Net cash provided by (used for) financing activities -18.65 -20.18 -18.65 18.68 -74.64 -29.12 -2.12 -275.49 302.49 -0.45 -4.69 7.18 -19.76 2.34 -26.43 0.00 -28.70 -11.59 -76.96 -0.31 -0.16 -0.15 0.04 0.11 -0.23 Effect of exchange rate changes Cash at beginning of period Net change in cash Cash at end of period 8.45 10.81 19.26 19.26 -6.83 12.43 12.43 2.03 14.47 14.47 2.56 17.03 17.03 9.52 26.55 15.30 18.34 33.64Step by Step Solution
There are 3 Steps involved in it
Step: 1

Get Instant Access to Expert-Tailored Solutions
See step-by-step solutions with expert insights and AI powered tools for academic success
Step: 2

Step: 3
Ace Your Homework with AI
Get the answers you need in no time with our AI-driven, step-by-step assistance
Get Started
Wealth Inequality Asset Redistribution And Risk Sharing Islamic Finance
Authors: Tarik Akin , Abbas Mirakhor
1st Edition
3110583739, 3110583887, 9783110583885