

Answered step by step
Verified Expert Solution
Question
1 Approved Answer
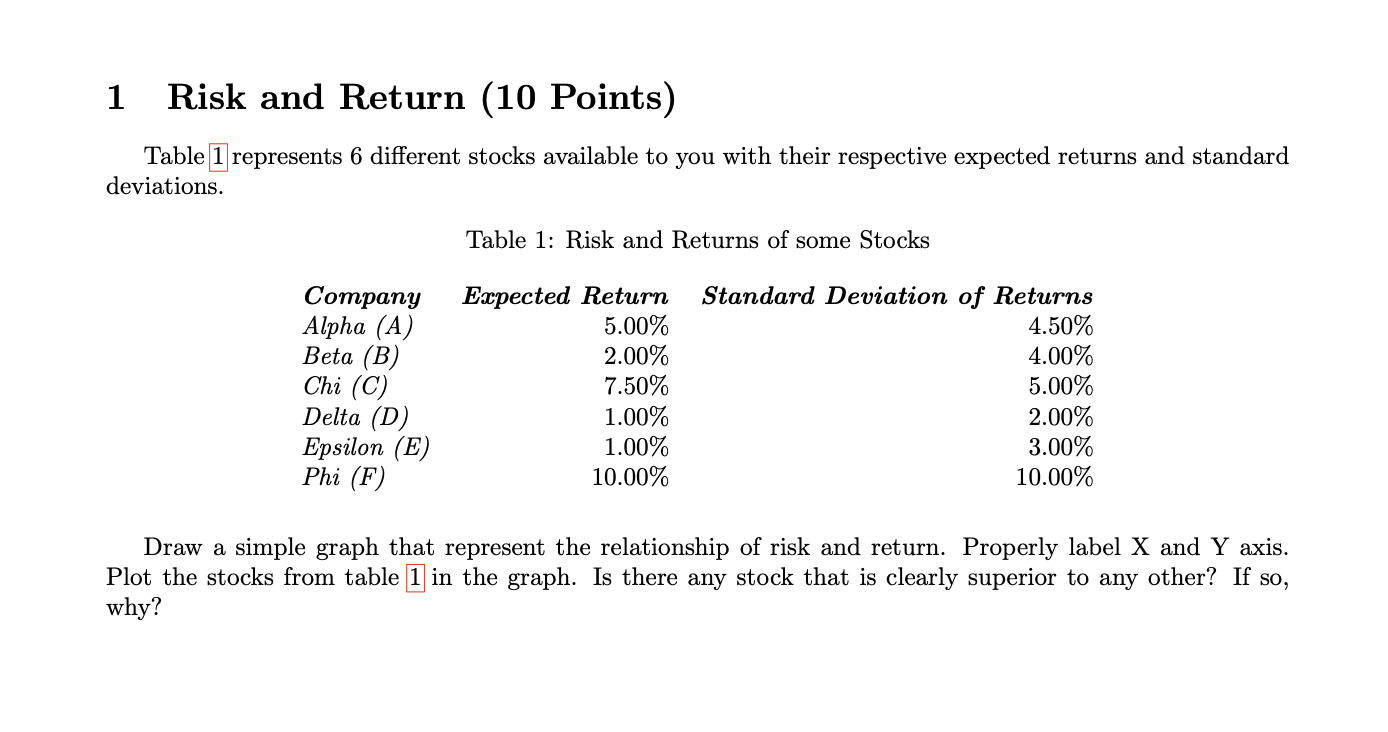
1 Risk and Return (10 Points) Table 1 represents 6 different stocks available to you with their respective expected returns and standard deviations. Table 1:
Step by Step Solution
There are 3 Steps involved in it
Step: 1

Get Instant Access to Expert-Tailored Solutions
See step-by-step solutions with expert insights and AI powered tools for academic success
Step: 2

Step: 3
Ace Your Homework with AI
Get the answers you need in no time with our AI-driven, step-by-step assistance
Get Started
Airline Finance
Authors: Peter S. Morrell
3rd Edition
0815387520, 9780815387527