Answered step by step
Verified Expert Solution
Question
1 Approved Answer
1. Round and present properly following values: a=123.4773, b=2.997-10-31, u(a)=2.568 u(b)=313-10-35 c=23.77, u(c)=0.997 2. In a certain experiment the time was measured with manual
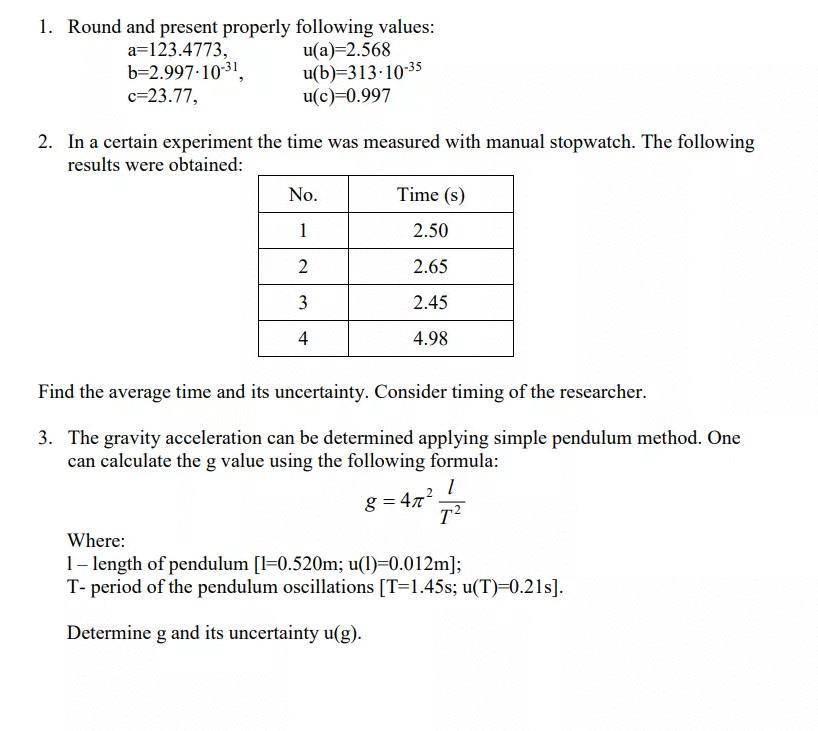
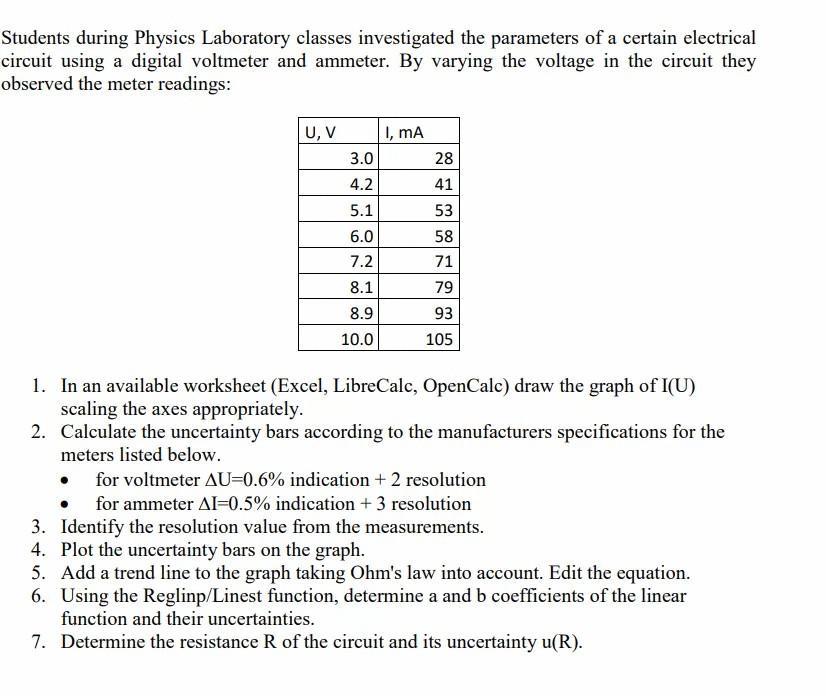
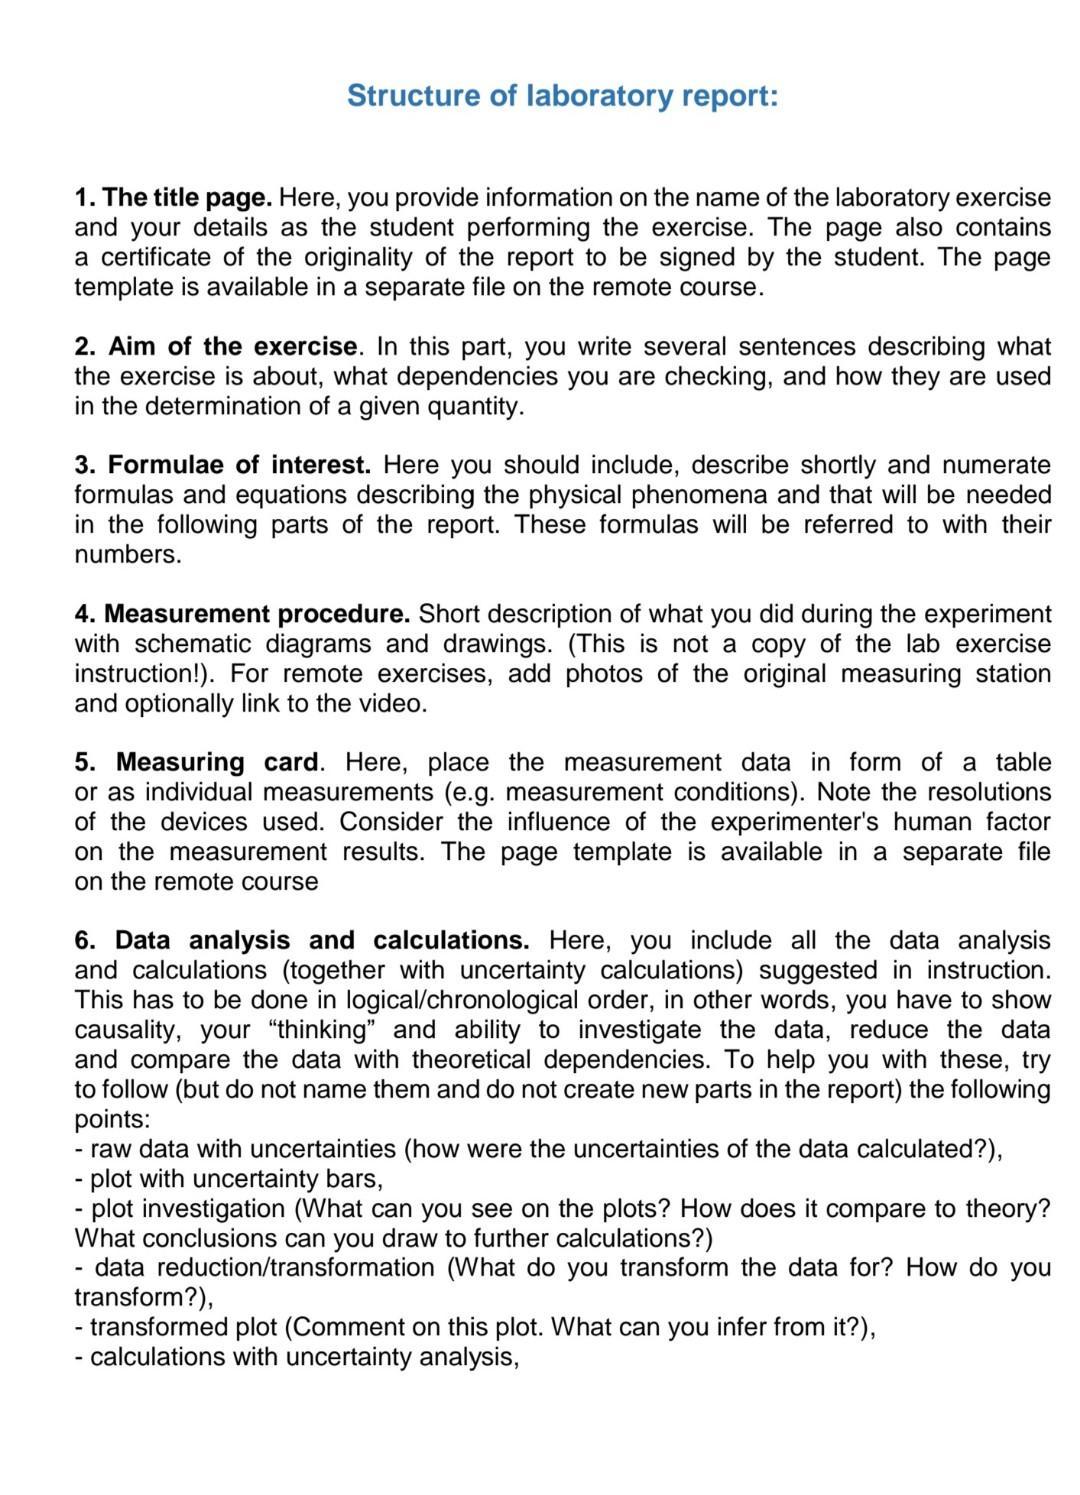
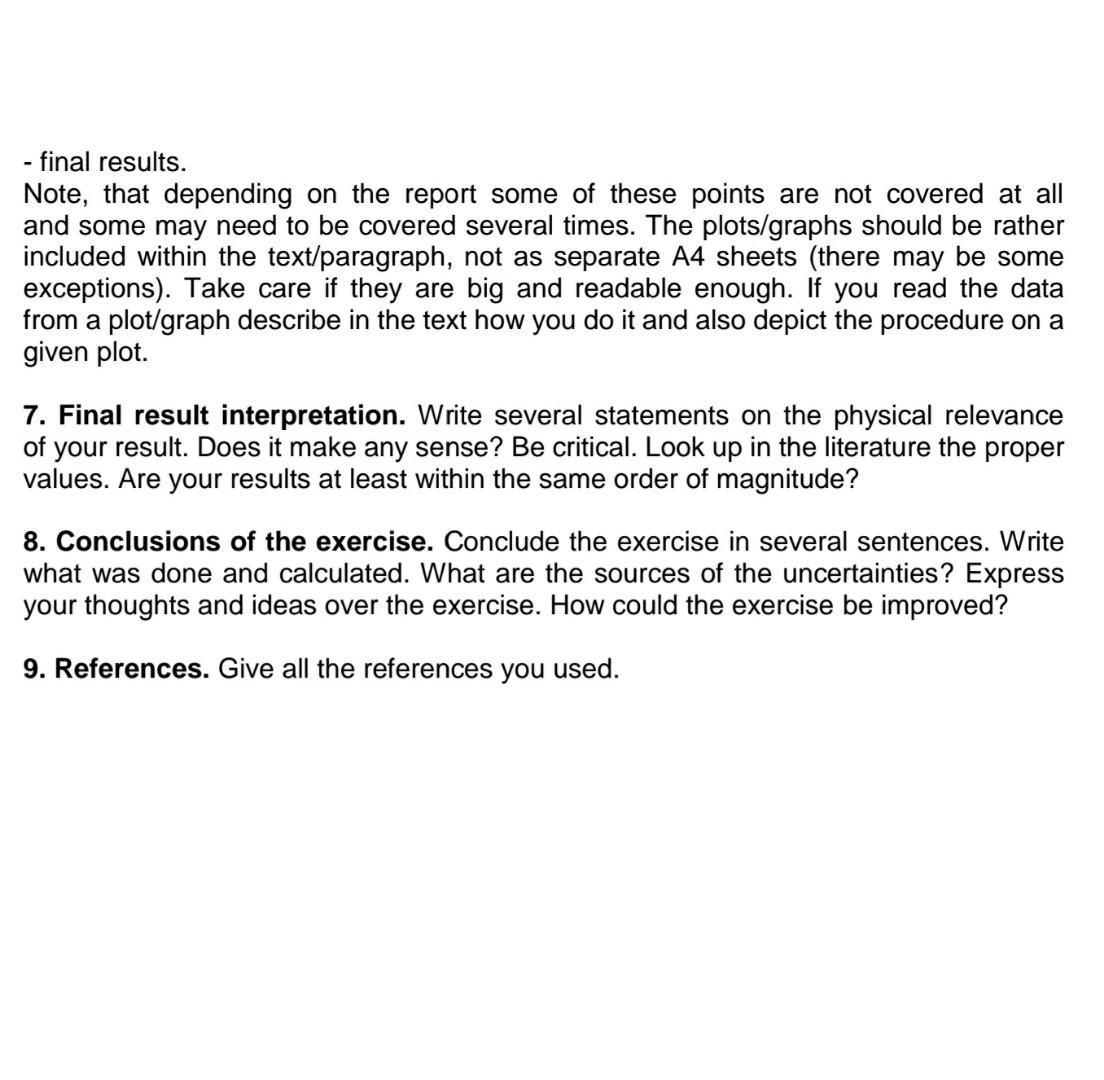
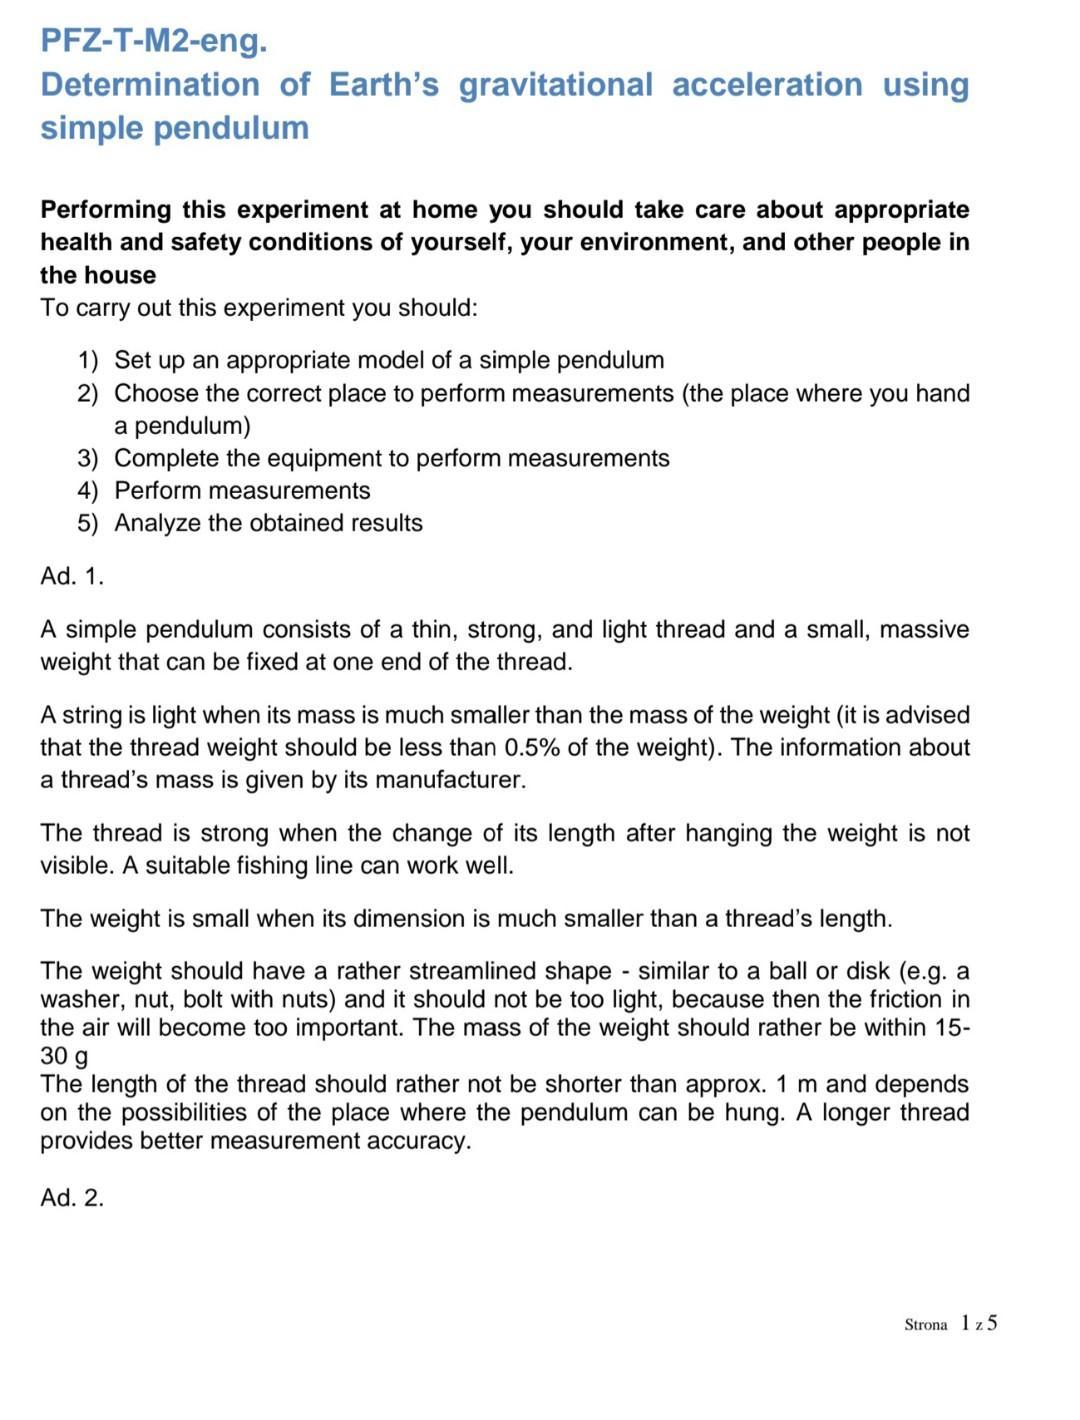
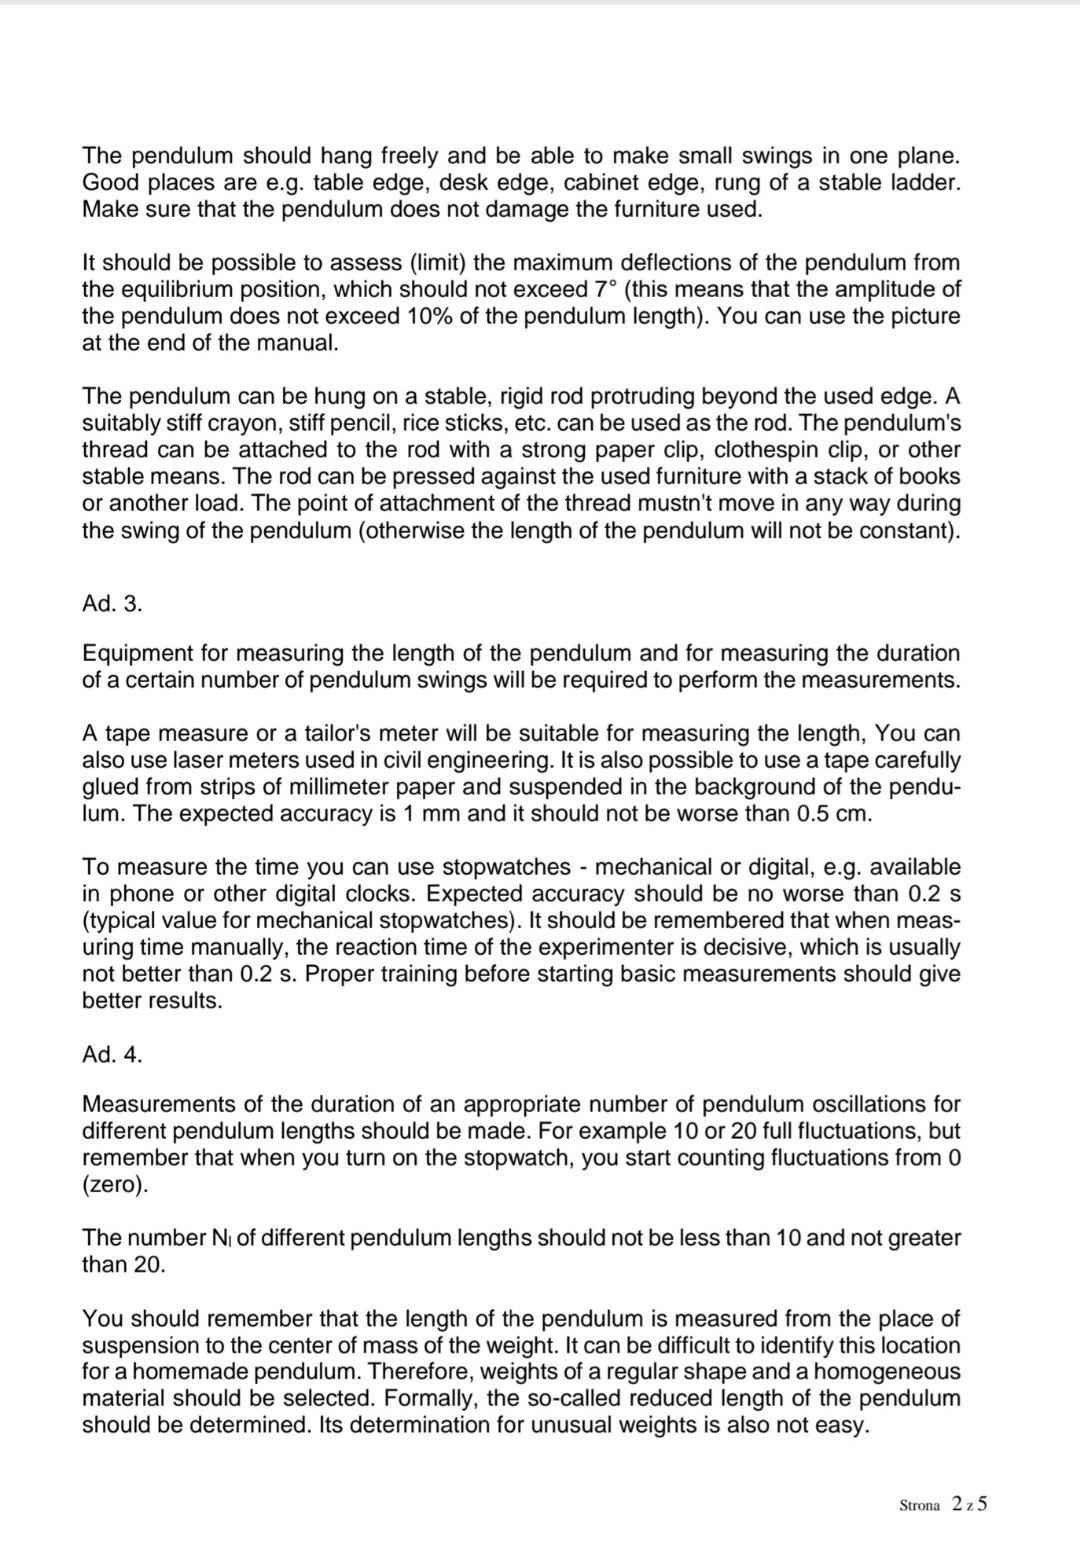
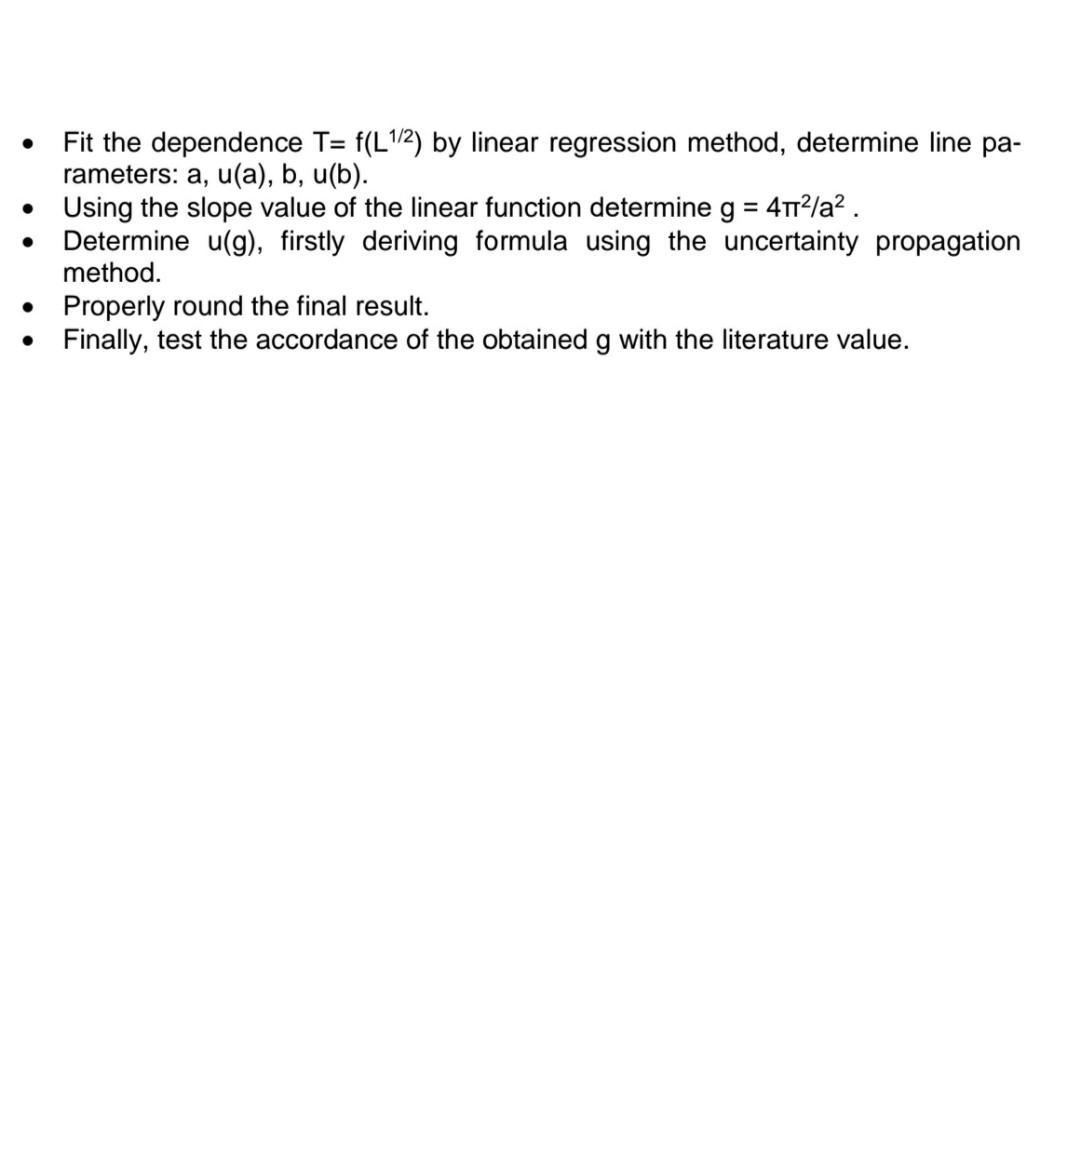
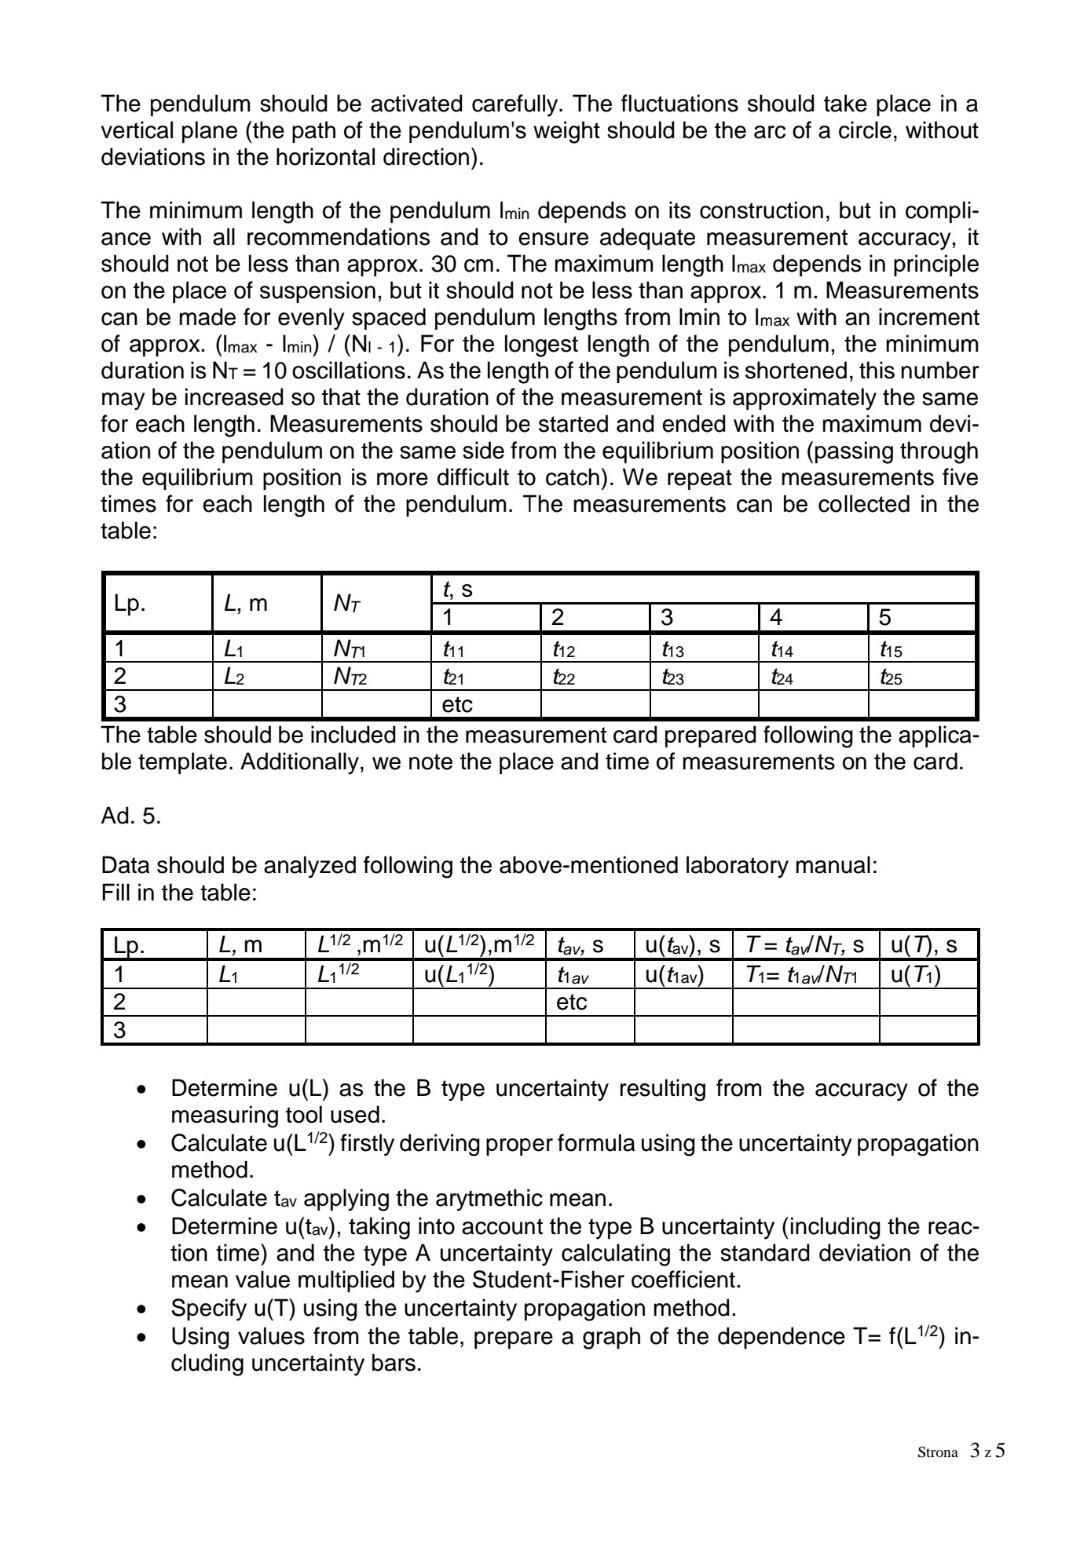
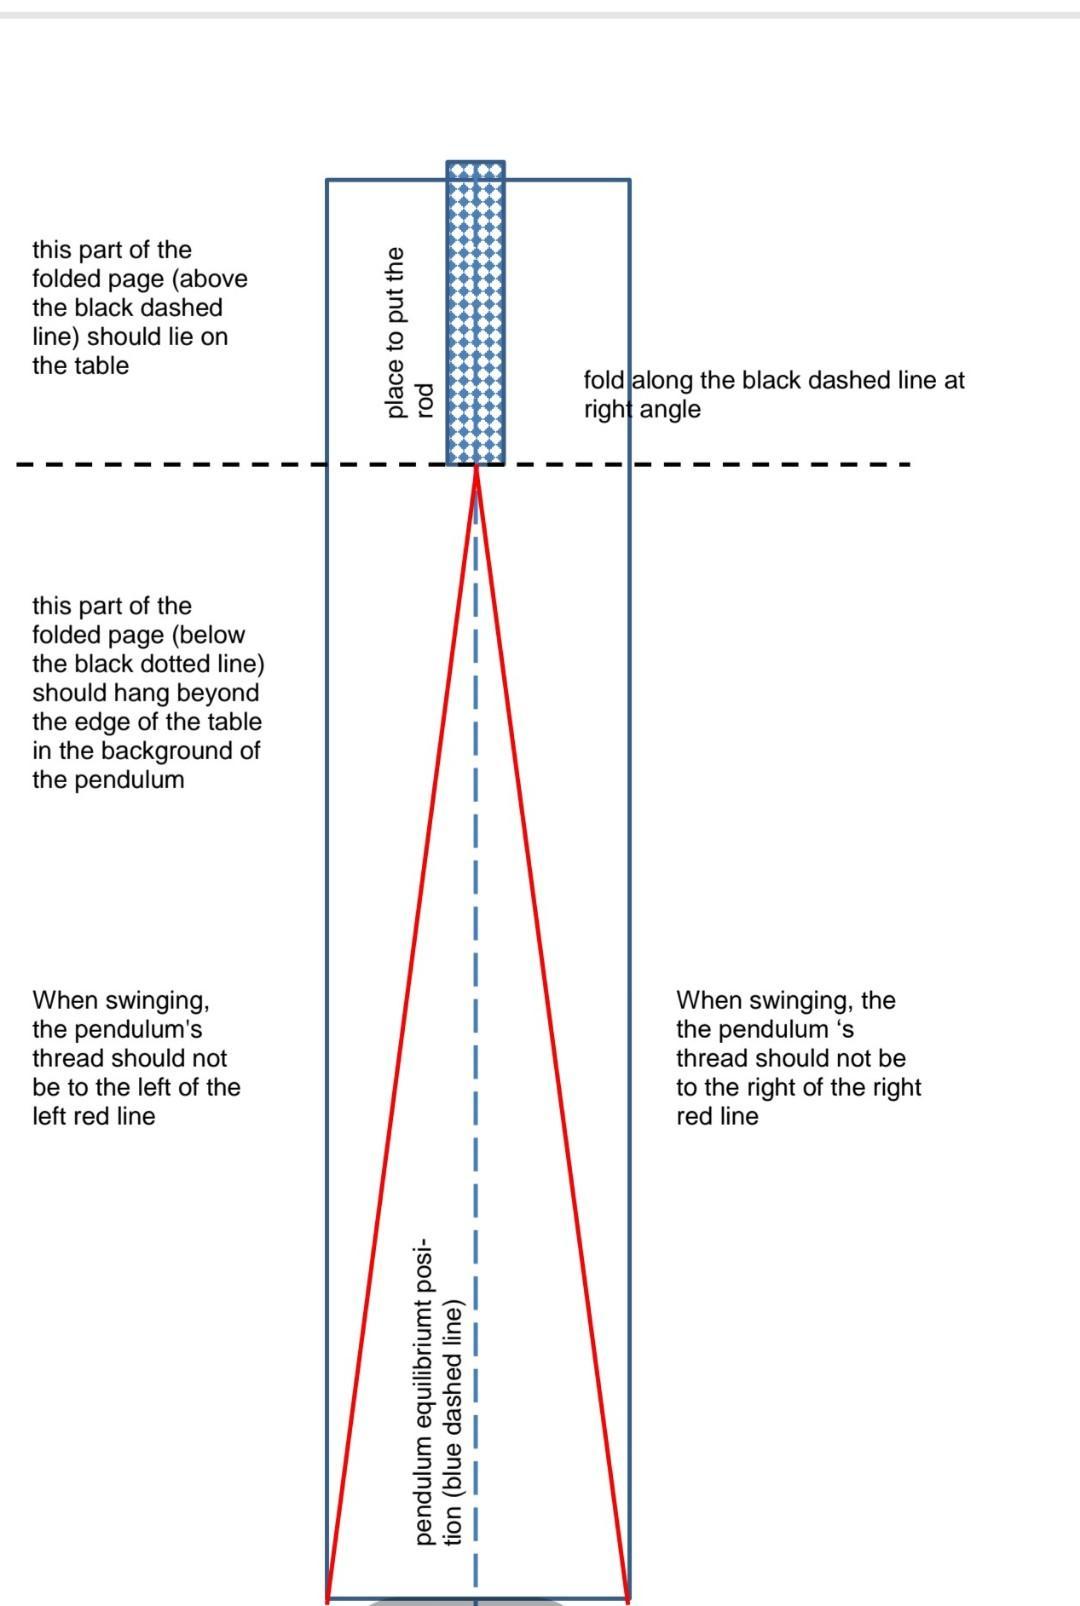
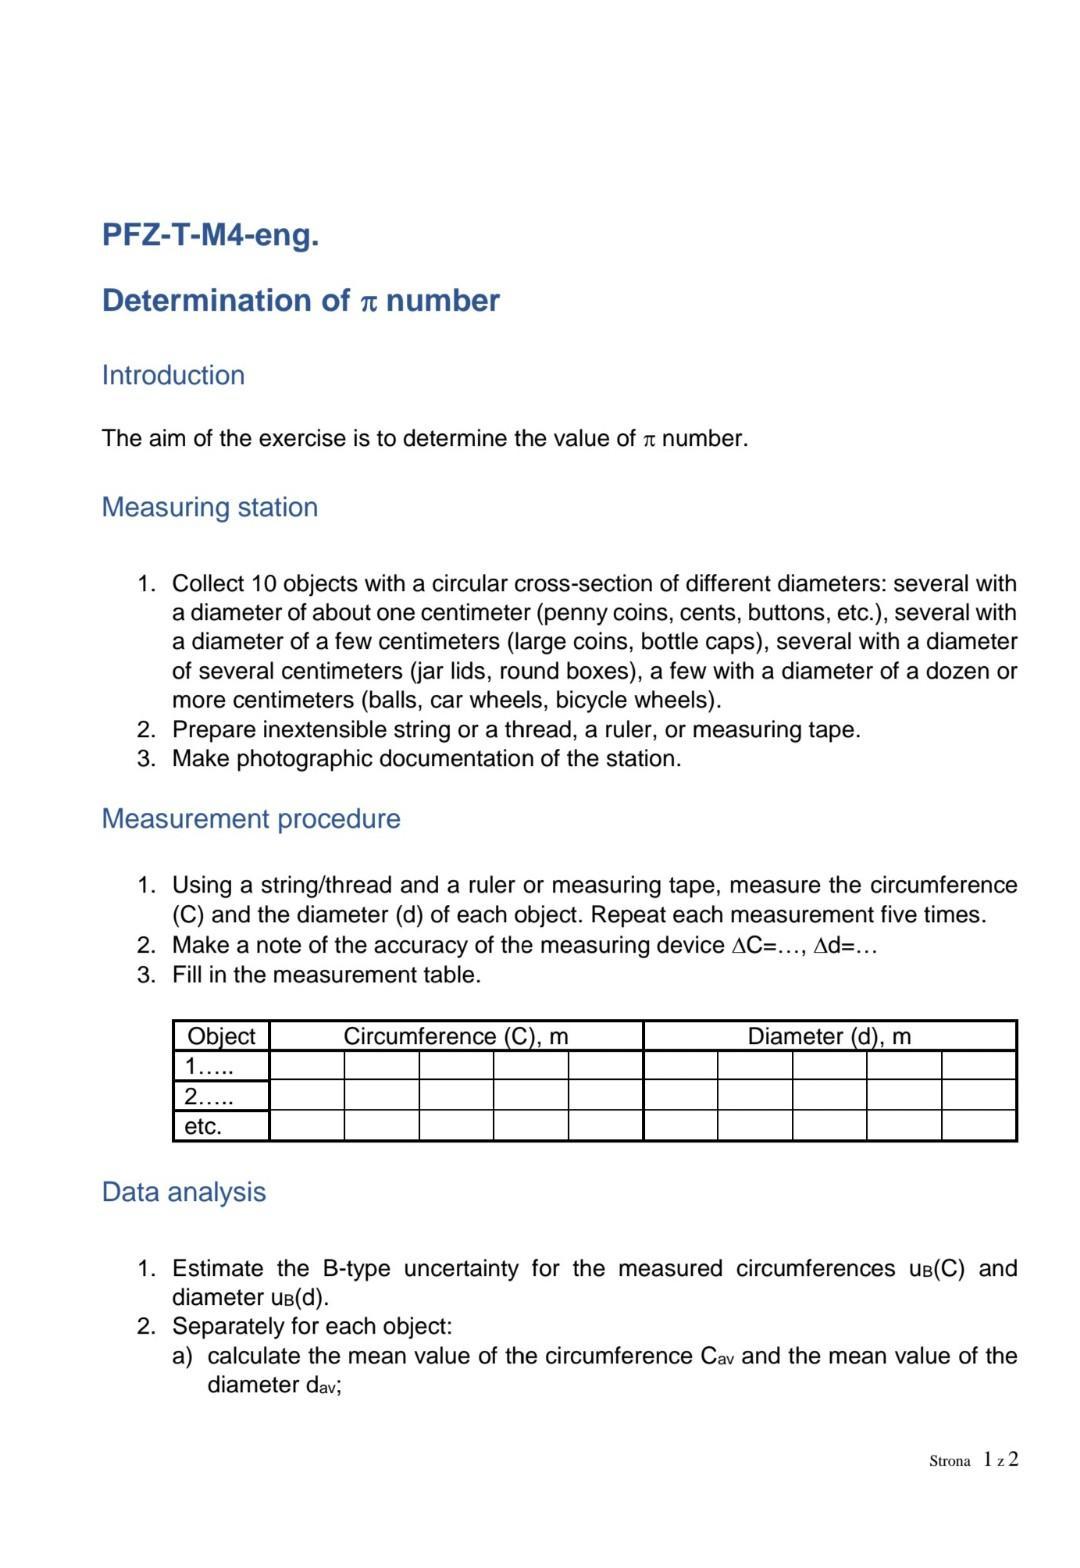
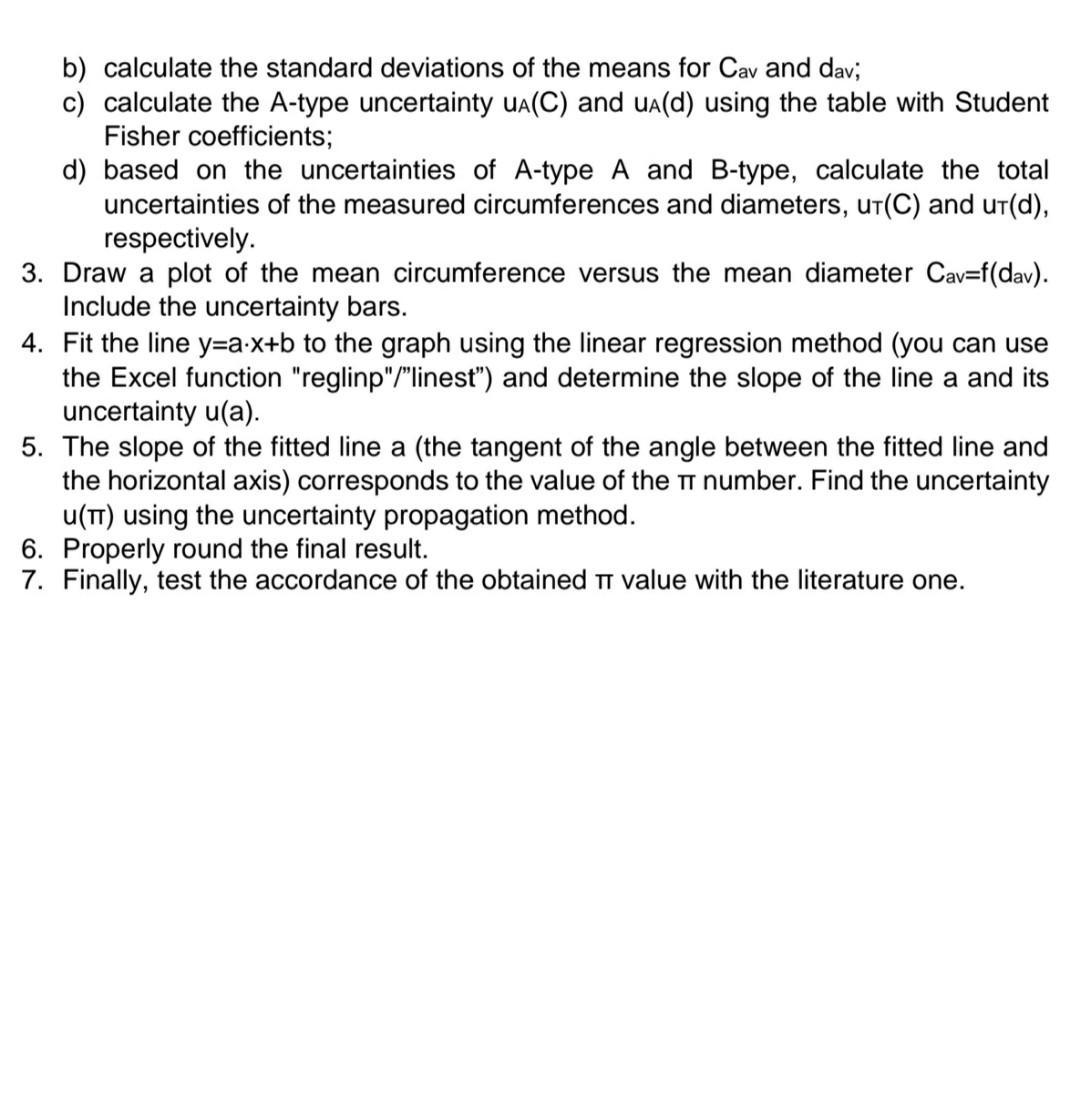
1. Round and present properly following values: a=123.4773, b=2.997-10-31, u(a)=2.568 u(b)=313-10-35 c=23.77, u(c)=0.997 2. In a certain experiment the time was measured with manual stopwatch. The following results were obtained: No. 1 2 3 4 Time (s) 2.50 2.65 2.45 4.98 Find the average time and its uncertainty. Consider timing of the researcher. 3. The gravity acceleration can be determined applying simple pendulum method. One can calculate the g value using the following formula: 17/12 T 8=47. Where: 1-length of pendulum [1=0.520m; u(1)=0.012m]; T- period of the pendulum oscillations [T=1.45s; u(T)=0.21s]. Determine g and its uncertainty u(g). Students during Physics Laboratory classes investigated the parameters of a certain electrical circuit using a digital voltmeter and ammeter. By varying the voltage in the circuit they observed the meter readings: U, V 3.0 4.2 5.1 6.0 7.2 8.1 8.9 10.0 I, MA 28 41 53 58 71 79 93 105 1. In an available worksheet (Excel, LibreCalc, OpenCalc) draw the graph of I(U) scaling the axes appropriately. 2. Calculate the uncertainty bars according to the manufacturers specifications for the meters listed below. for voltmeter AU=0.6% indication + 2 resolution for ammeter AI=0.5% indication + 3 resolution 3. Identify the resolution value from the measurements. 4. Plot the uncertainty bars on the graph. 5. Add a trend line to the graph taking Ohm's law into account. Edit the equation. 6. Using the Reglinp/Linest function, determine a and b coefficients of the linear function and their uncertainties. 7. Determine the resistance R of the circuit and its uncertainty u(R). Structure of laboratory report: 1. The title page. Here, you provide information on the name of the laboratory exercise and your details as the student performing the exercise. The page also contains a certificate of the originality of the report to be signed by the student. The page template is available in a separate file on the remote course. 2. Aim of the exercise. In this part, you write several sentences describing what the exercise is about, what dependencies you are checking, and how they are used in the determination of a given quantity. 3. Formulae of interest. Here you should include, describe shortly and numerate formulas and equations describing the physical phenomena and that will be needed in the following parts of the report. These formulas will be referred to with their numbers. 4. Measurement procedure. Short description of what you did during the experiment with schematic diagrams and drawings. (This is not a copy of the lab exercise instruction!). For remote exercises, add photos of the original measuring station and optionally link to the video. 5. Measuring card. Here, place the measurement data in form of a table or as individual measurements (e.g. measurement conditions). Note the resolutions of the devices used. Consider the influence of the experimenter's human factor on the measurement results. The page template is available in a separate file on the remote course 6. Data analysis and calculations. Here, you include all the data analysis and calculations (together with uncertainty calculations) suggested in instruction. This has to be done in logical/chronological order, in other words, you have to show causality, your "thinking" and ability to investigate the data, reduce the data and compare the data with theoretical dependencies. To help you with these, try to follow (but do not name them and do not create new parts in the report) the following points: - raw data with uncertainties (how were the uncertainties of the data calculated?), - plot with uncertainty bars, plot investigation (What can you see on the plots? How does it compare to theory? What conclusions can you draw to further calculations?) data reduction/transformation (What do you transform the data for? How do you transform?), - transformed plot (Comment on this plot. What can you infer from it?), - calculations with uncertainty analysis, - final results. Note, that depending on the report some of these points are not covered at all and some may need to be covered several times. The plots/graphs should be rather included within the text/paragraph, not as separate A4 sheets (there may be some exceptions). Take care if they are big and readable enough. If you read the data from a plot/graph describe in the text how you do it and also depict the procedure on a given plot. 7. Final result interpretation. Write several statements on the physical relevance of your result. Does it make any sense? Be critical. Look up in the literature the proper values. Are your results at least within the same order of magnitude? 8. Conclusions of the exercise. Conclude the exercise in several sentences. Write what was done and calculated. What are the sources of the uncertainties? Express your thoughts and ideas over the exercise. How could the exercise be improved? 9. References. Give all the references you used. PFZ-T-M2-eng. Determination of Earth's gravitational acceleration using simple pendulum Performing this experiment at home you should take care about appropriate health and safety conditions of yourself, your environment, and other people in the house To carry out this experiment you should: 1) Set up an appropriate model of a simple pendulum 2) Choose the correct place to perform measurements (the place where you hand a pendulum) 3) Complete the equipment to perform measurements 4) Perform measurements 5) Analyze the obtained results Ad. 1. A simple pendulum consists of a thin, strong, and light thread and a small, massive weight that can be fixed at one end of the thread. A string is light when its mass is much smaller than the mass of the weight (it is advised that the thread weight should be less than 0.5% of the weight). The information about a thread's mass is given by its manufacturer. The thread is strong when the change of its length after hanging the weight is not visible. A suitable fishing line can work well. The weight is small when its dimension is much smaller than a thread's length. The weight should have a rather streamlined shape - similar to a ball or disk (e.g. a washer, nut, bolt with nuts) and it should not be too light, because then the friction in the air will become too important. The mass of the weight should rather be within 15- 30 g The length of the thread should rather not be shorter than approx. 1 m and depends on the possibilities of the place where the pendulum can be hung. A longer thread provides better measurement accuracy. Ad. 2. Strona 1 z 5 The pendulum should hang freely and be able to make small swings in one plane. Good places are e.g. table edge, desk edge, cabinet edge, rung of a stable ladder. Make sure that the pendulum does not damage the furniture used. It should be possible to assess (limit) the maximum deflections of the pendulum from the equilibrium position, which should not exceed 7 (this means that the amplitude of the pendulum does not exceed 10% of the pendulum length). You can use the picture at the end of the manual. The pendulum can be hung on a stable, rigid rod protruding beyond the used edge. A suitably stiff crayon, stiff pencil, rice sticks, etc. can be used as the rod. The pendulum's thread can be attached to the rod with a strong paper clip, clothespin clip, or other stable means. The rod can be pressed against the used furniture with a stack of books or another load. The point of attachment of the thread mustn't move in any way during the swing of the pendulum (otherwise the length of the pendulum will not be constant). Ad. 3. Equipment for measuring the length of the pendulum and for measuring the duration of a certain number of pendulum swings will be required to perform the measurements. A tape measure or a tailor's meter will be suitable for measuring the length, You can also use laser meters used in civil engineering. It is also possible to use a tape carefully glued from strips of millimeter paper and suspended in the background of the pendu- lum. The expected accuracy is 1 mm and it should not be worse than 0.5 cm. To measure the time you can use stopwatches- mechanical or digital, e.g. available in phone or other digital clocks. Expected accuracy should be no worse than 0.2 s (typical value for mechanical stopwatches). It should be remembered that when meas- uring time manually, the reaction time of the experimenter is decisive, which is usually not better than 0.2 s. Proper training before starting basic measurements should give better results. Ad. 4. Measurements of the duration of an appropriate number of pendulum oscillations for different pendulum lengths should be made. For example 10 or 20 full fluctuations, but remember that when you turn on the stopwatch, you start counting fluctuations from 0 (zero). The number N of different pendulum lengths should not be less than 10 and not greater than 20. You should remember that the length of the pendulum is measured from the place of suspension to the center of mass of the weight. It can be difficult to identify this location for a homemade pendulum. Therefore, weights of a regular shape and a homogeneous material should be selected. Formally, the so-called reduced length of the pendulum should be determined. Its determination for unusual weights is also not easy. Strona 2 z 5 Fit the dependence T=f(L/2) by linear regression method, determine line pa- rameters: a, u(a), b, u(b). Using the slope value of the linear function determine g = 4+/a. Determine u(g), firstly deriving formula using the uncertainty propagation method. Properly round the final result. Finally, test the accordance of the obtained g with the literature value. The pendulum should be activated carefully. The fluctuations should take place in a vertical plane (the path of the pendulum's weight should be the arc of a circle, without deviations in the horizontal direction). The minimum length of the pendulum Imin depends on its construction, but in compli- ance with all recommendations and to ensure adequate measurement accuracy, it should not be less than approx. 30 cm. The maximum length Imax depends in principle on the place of suspension, but it should not be less than approx. 1 m. Measurements can be made for evenly spaced pendulum lengths from Imin to Imax with an increment of approx. (Imax - Imin) / (N-1). For the longest length of the pendulum, the minimum duration is NT = 10 oscillations. As the length of the pendulum is shortened, this number may be increased so that the duration of the measurement is approximately the same for each length. Measurements should be started and ended with the maximum devi- ation of the pendulum on the same side from the equilibrium position (passing through the equilibrium position is more difficult to catch). We repeat the measurements five times for each length of the pendulum. The measurements can be collected in the table: Lp. 1 2 3 Lp. 1 2 3 L, m L L2 NT NT2 L, m L t, s 1 The table should be included in the measurement card prepared following the applica- ble template. Additionally, we note the place and time of measurements on the card. Ad. 5. Data should be analyzed following the above-mentioned laboratory manual: Fill in the table: t11 t21 etc 2 L1/2 ,m1/2 u(L1/2),m1/2 L1/2 u(L1/2) t12 t22 3 t13 t23 tav, S t av etc 4 t14 t24 5 t15 t25 u(tav), S T = tav/NT, S u(tiav) T= t1a/ NT1 u(7), s u(T) Determine u(L) as the B type uncertainty resulting from the accuracy of the measuring tool used. Calculate u(L/2) firstly deriving proper formula using the uncertainty propagation method. Calculate tav applying the arytmethic mean. Determine u(tav), taking into account the type B uncertainty (including the reac- tion time) and the type A uncertainty calculating the standard deviation of the mean value multiplied by the Student-Fisher coefficient. Specify u(T) using the uncertainty propagation method. Using values from the table, prepare a graph of the dependence T= f(L/2) in- cluding uncertainty bars. Strona 3 z 5 this part of the folded page (above the black dashed line) should lie on the table this part of the folded page (below the black dotted line) should hang beyond the edge of the table in the background of the pendulum When swinging, the pendulum's thread should not be to the left of the left red line place to put the rod pendulum equilibriumt posi- tion (blue dashed line) fold along the black dashed line at right angle When swinging, the the pendulum 's thread should not be to the right of the right red line PFZ-T-M4-eng. Determination of a number Introduction The aim of the exercise is to determine the value of number. Measuring station 1. Collect 10 objects with a circular cross-section of different diameters: several with a diameter of about one centimeter (penny coins, cents, buttons, etc.), several with a diameter of a few centimeters (large coins, bottle caps), several with a diameter of several centimeters (jar lids, round boxes), a few with a diameter of a dozen or more centimeters (balls, car wheels, bicycle wheels). 2. Prepare inextensible string or a thread, a ruler, or measuring tape. 3. Make photographic documentation of the station. Measurement procedure 1. Using a string/thread and a ruler or measuring tape, measure the circumference (C) and the diameter (d) of each object. Repeat each measurement five times. 2. Make a note of the accuracy of the measuring device AC=..., Ad=... 3. Fill in the measurement table. Object 1..... 2..... etc. Circumference (C), m Diameter (d), m Data analysis 1. Estimate the B-type uncertainty for the measured circumferences UB(C) and diameter UB(d). 2. Separately for each object: a) calculate the mean value of the circumference Cav and the mean value of the diameter dav; Strona 1 z 2 b) calculate the standard deviations of the means for Cav and dav; c) calculate the A-type uncertainty UA(C) and UA(d) using the table with Student Fisher coefficients; d) based on the uncertainties of A-type A and B-type, calculate the total uncertainties of the measured circumferences and diameters, UT(C) and uT(d), respectively. 3. Draw a plot of the mean circumference versus the mean diameter Cav=f(dav). Include the uncertainty bars. 4. Fit the line y-ax+b to the graph using the linear regression method (you can use the Excel function "reglinp"/"linest") and determine the slope of the line a and its uncertainty u(a). 5. The slope of the fitted line a (the tangent of the angle between the fitted line and the horizontal axis) corresponds to the value of the T number. Find the uncertainty u(TT) using the uncertainty propagation method. 6. Properly round the final result. 7. Finally, test the accordance of the obtained value with the literature one.
Step by Step Solution
★★★★★
3.52 Rating (155 Votes )
There are 3 Steps involved in it
Step: 1

Get Instant Access to Expert-Tailored Solutions
See step-by-step solutions with expert insights and AI powered tools for academic success
Step: 2

Step: 3

Ace Your Homework with AI
Get the answers you need in no time with our AI-driven, step-by-step assistance
Get Started


