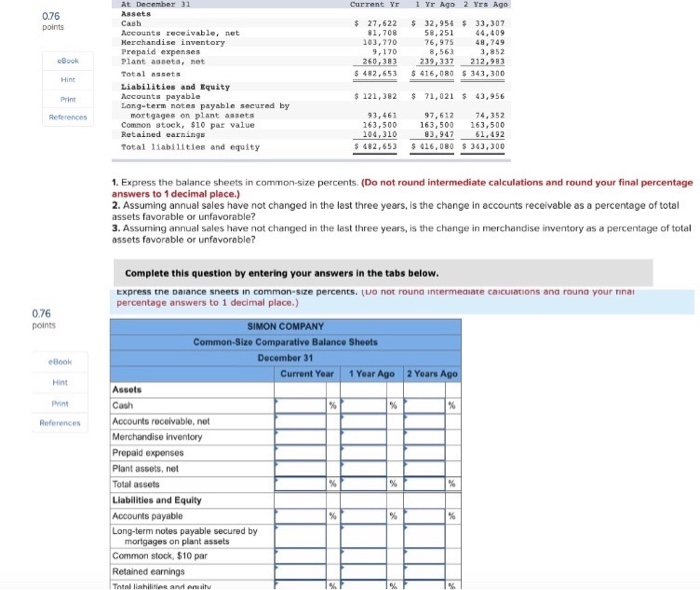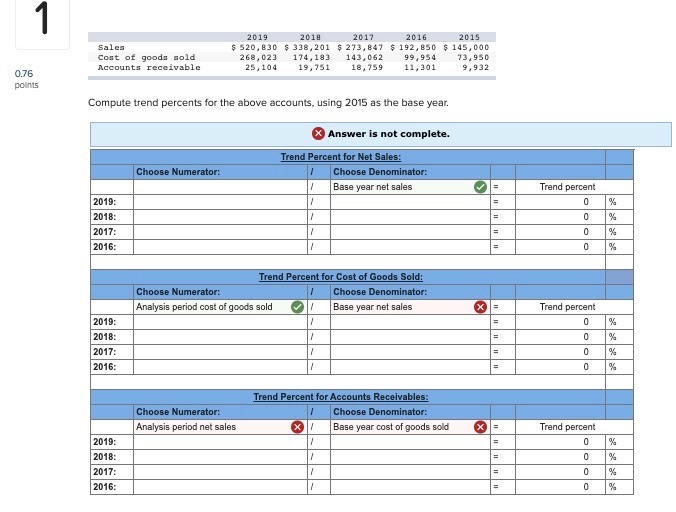
1 Sales Cost of goods sold Accounts receivable 2019 2018 2017 2016 2015 $ 520,830 $ 338,201 $ 273,847 $ 192,850 $ 145,000 268,023 174,183 143,062 99,954 73,950 25,104 19,751 18,759 11,301 9,932 0.76 points Compute trend percents for the above accounts, using 2015 as the base year. Answer is not complete. Trend Percent for Net Sales: Choose Denominator: Base year net sales Choose Numerator: = Trend percent 0 0 0 0 2019: 2018: 2017: 2016: % % % Trend Percent for Cost of Goods Sold: Choose Numerator: Choose Denominator: Analysis period cost of goods sold Base year net sales X = / % Trend percent 0 0 0 0 2019: 2018: 2017: 2016: % % Choose Numerator: Analysis period net sales Trend Percent for Accounts Receivables: Choose Denominator: X/ Base year cost of goods sold X = Trend percent 0 2019: 2018: 2017: 2016: % % % 0 = 0 % Current Yr 1 yr Ago 2 Yes Ago 0.76 points $ 27,622 81,708 103,770 9,170 260,300 $ 482,653 $ 32,950 $33,307 58,251 44,409 76,975 48,749 8,563 3,852 239,337 212,983 $ 416,080 $ 343,300 At December 31 Assets Cash Accounts receivable, net Merchandise inventory Prepaid expenses Plant assets, net Total ansata Liabilities and Equity Accounts payable Long-term notes payable secured by mortgages on plant assets Common stock, $10 par value Retained warnings Total 11abilities and equity Book Print References $ 121,382 $ 71,021 $ 43,956 93,461 97,612 74,352 163,500 163,500 163,500 104,310 83,947 61,492 $ 482,653 $ 416,080 $ 343,300 1. Express the balance sheets in common-size percents. (Do not round intermediate calculations and round your final percentage answers to 1 decimal place.) 2. Assuming annual sales have not changed in the last three years, is the change in accounts receivable as a percentage of total assets favorable or unfavorable? 3. Assuming annual sales have not changed in the last three years, is the change in merchandise inventory as a percentage of total assets favorable or unfavorable? 0.76 points book % References Complete this question by entering your answers in the tabs below. Express the balance sneets in common-size percents. (uo not rouna intermediate calculations ana rouna your final percentage answers to 1 decimal place.) SIMON COMPANY Common-Size Comparative Balance Shoots December 31 Current Year 1 Year Ago 2 Years Ago Assets Cash Accounts receivable, not Merchandise inventory Prepaid expenses Plant assets, not Total assets Liabilities and Equity Accounts payablo Long-term notes payable secured by mortgages on plant assets Common stock, $10 par Retained earnings Total lahilan % % % %


