Answered step by step
Verified Expert Solution
Question
1 Approved Answer
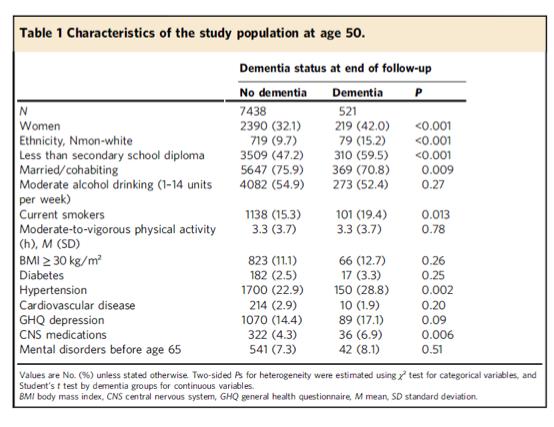
1. set up a hypothesis for the following variables: a) married/cohabiting, b) current smokers, c) GHQ depression 2. calculate test statistics for Q1 (report differences,
1. set up a hypothesis for the following variables: a) married/cohabiting, b) current smokers, c) GHQ depression
2. calculate test statistics for Q1 (report differences, z-value, and p-values, keep 4 decimal points).
3. if redo a comparison study, try to examine the difference between the two groups (no dementia vs. dementia) in GHQ depression, you are asked to calculate a) effect size, b) sample size for each group @ α=0.05 and β=0.2.
Table 1 Characteristics of the study population at age 50. N Women Ethnicity, Nmon-white- Less than secondary school diploma Married/cohabiting Moderate alcohol drinking (1-14 units per week) Current smokers Moderate-to-vigorous physical activity (h), M (SD) BMI 30 kg/m Diabetes Hypertension Cardiovascular disease GHQ depression CNS medications Mental disorders before age 65 Dementia status at end of follow-up Dementia P 521 219 (42.0) 79 (15.2) No dementia 7438 2390 (321) 719 (9.7) 3509 (47.2) 5647 (75.9) 4082 (54.9) 1138 (15.3) 3.3 (3.7) 823 (11.1) 182 (2.5) 1700 (22.9) 214 (2.9) 1070 (14.4) 322 (4.3) 541 (7.3) 310 (59.5) 369 (70.8) 273 (52.4) 101 (19.4) 3.3 (3.7) 66 (12.7) 17 (3.3) 150 (28.8) 10 (1.9) 89 (17.1) 36 (6.9) 42 (8.1)
Step by Step Solution
There are 3 Steps involved in it
Step: 1
Answers and Explanation Hypotheses a Marriedcohabiting There is no difference in the proportion of marriedcohabiting individuals between the two dementia groups H0 pNoDemarried pDemarried Ha pNoDemarr...
Get Instant Access to Expert-Tailored Solutions
See step-by-step solutions with expert insights and AI powered tools for academic success
Step: 2

Step: 3

Ace Your Homework with AI
Get the answers you need in no time with our AI-driven, step-by-step assistance
Get Started


