Question
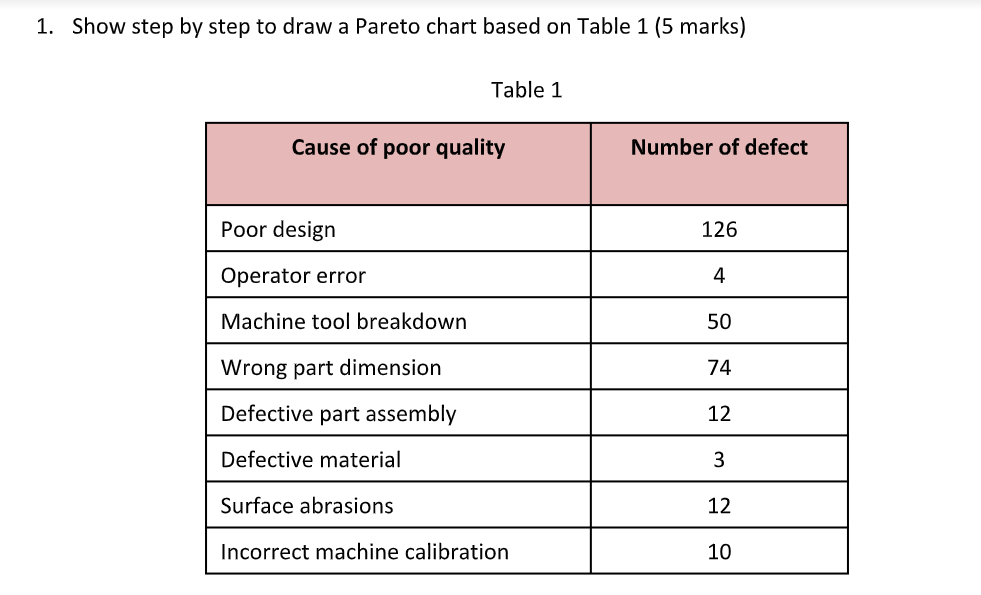
1. Show step by step to draw a Pareto chart based on Table 1 (5 marks) Table 1 Cause of poor quality Poor design

1. Show step by step to draw a Pareto chart based on Table 1 (5 marks) Table 1 Cause of poor quality Poor design Operator error Machine tool breakdown Wrong part dimension Defective part assembly Defective material Surface abrasions Incorrect machine calibration Number of defect 126 4 50 74 12 3 12 10
Step by Step Solution
3.41 Rating (154 Votes )
There are 3 Steps involved in it
Step: 1
To create a Pareto chart based on the data in Table 1 you can follow these steps 1 Organize the data Sort the causes of poor quality in descending ord...
Get Instant Access to Expert-Tailored Solutions
See step-by-step solutions with expert insights and AI powered tools for academic success
Step: 2

Step: 3

Ace Your Homework with AI
Get the answers you need in no time with our AI-driven, step-by-step assistance
Get StartedRecommended Textbook for
Introduction to Operations and Supply Chain Management
Authors: Cecil B. Bozarth, Robert B. Handfield
3rd edition
132747324, 978-0132747325
Students also viewed these General Management questions
Question
Answered: 1 week ago
Question
Answered: 1 week ago
Question
Answered: 1 week ago
Question
Answered: 1 week ago
Question
Answered: 1 week ago
Question
Answered: 1 week ago
Question
Answered: 1 week ago
Question
Answered: 1 week ago
Question
Answered: 1 week ago
Question
Answered: 1 week ago
Question
Answered: 1 week ago
Question
Answered: 1 week ago
Question
Answered: 1 week ago
Question
Answered: 1 week ago
Question
Answered: 1 week ago
Question
Answered: 1 week ago
Question
Answered: 1 week ago
Question
Answered: 1 week ago
Question
Answered: 1 week ago
Question
Answered: 1 week ago
Question
Answered: 1 week ago
Question
Answered: 1 week ago
Question
Answered: 1 week ago
Question
Answered: 1 week ago
View Answer in SolutionInn App


