

Answered step by step
Verified Expert Solution
Question
1 Approved Answer
1. Simulate 250 realizations of log returns of two stocks both obeying normal distributions with means zero, standard deviations 0.02 and 0.04 , respectively, if
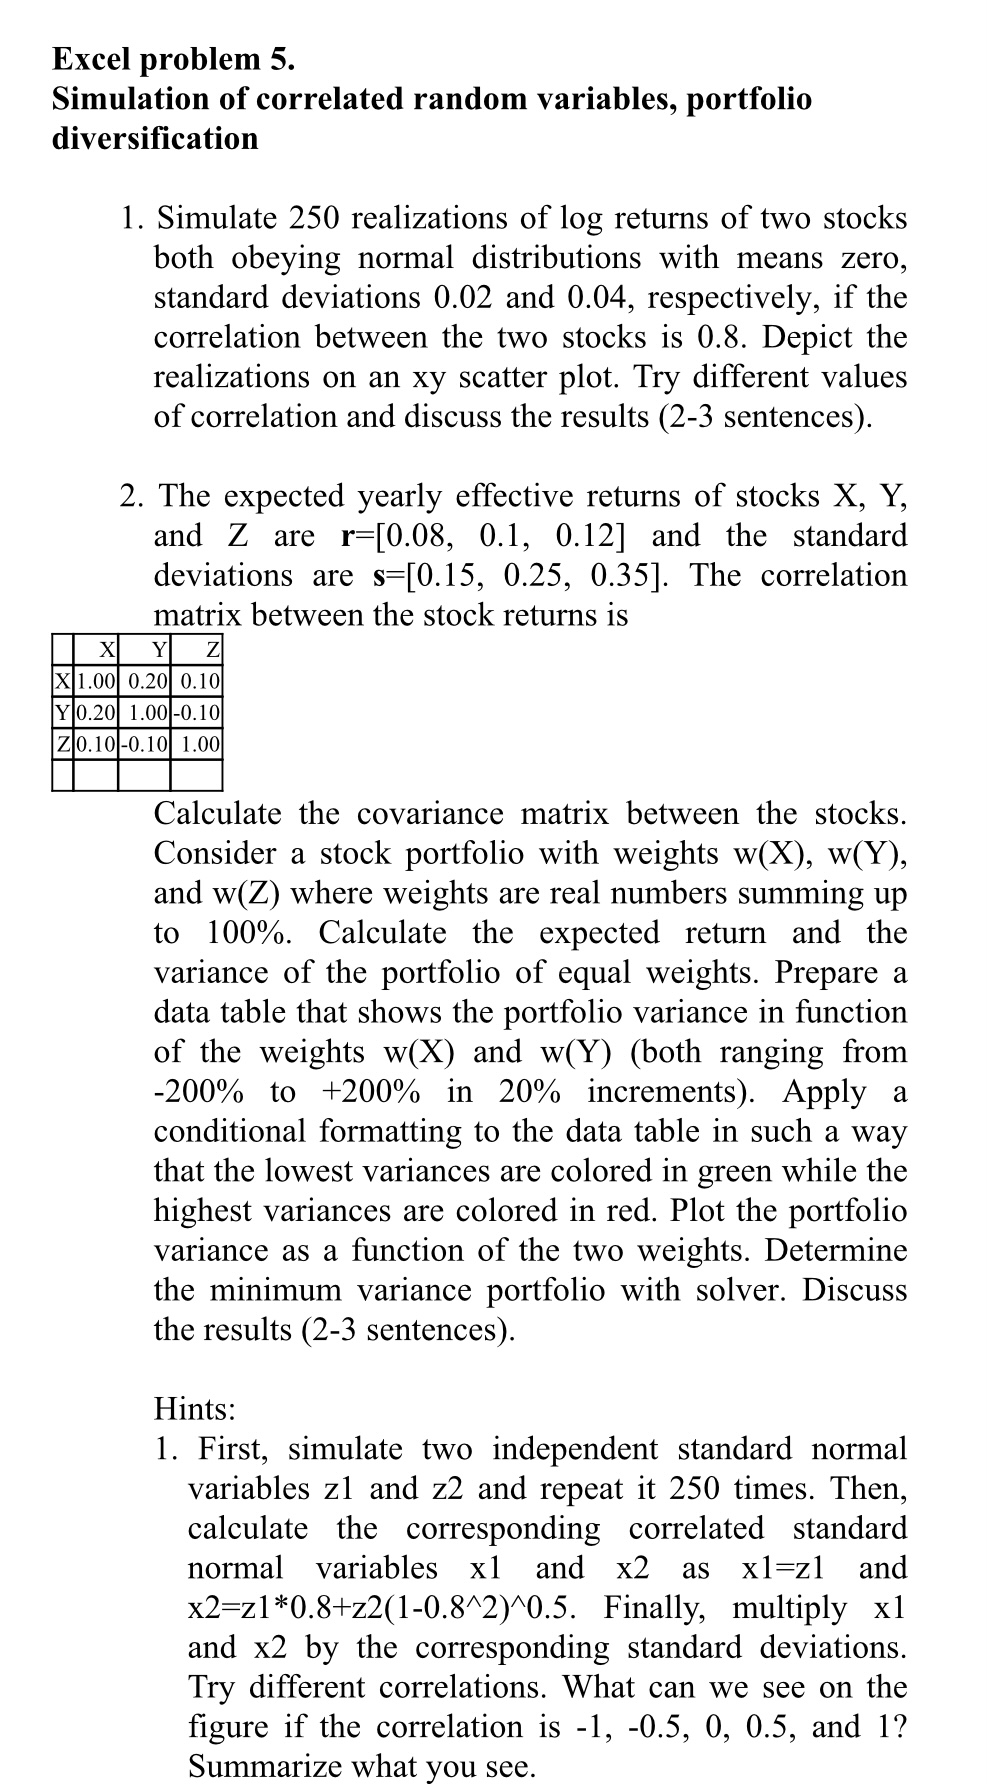
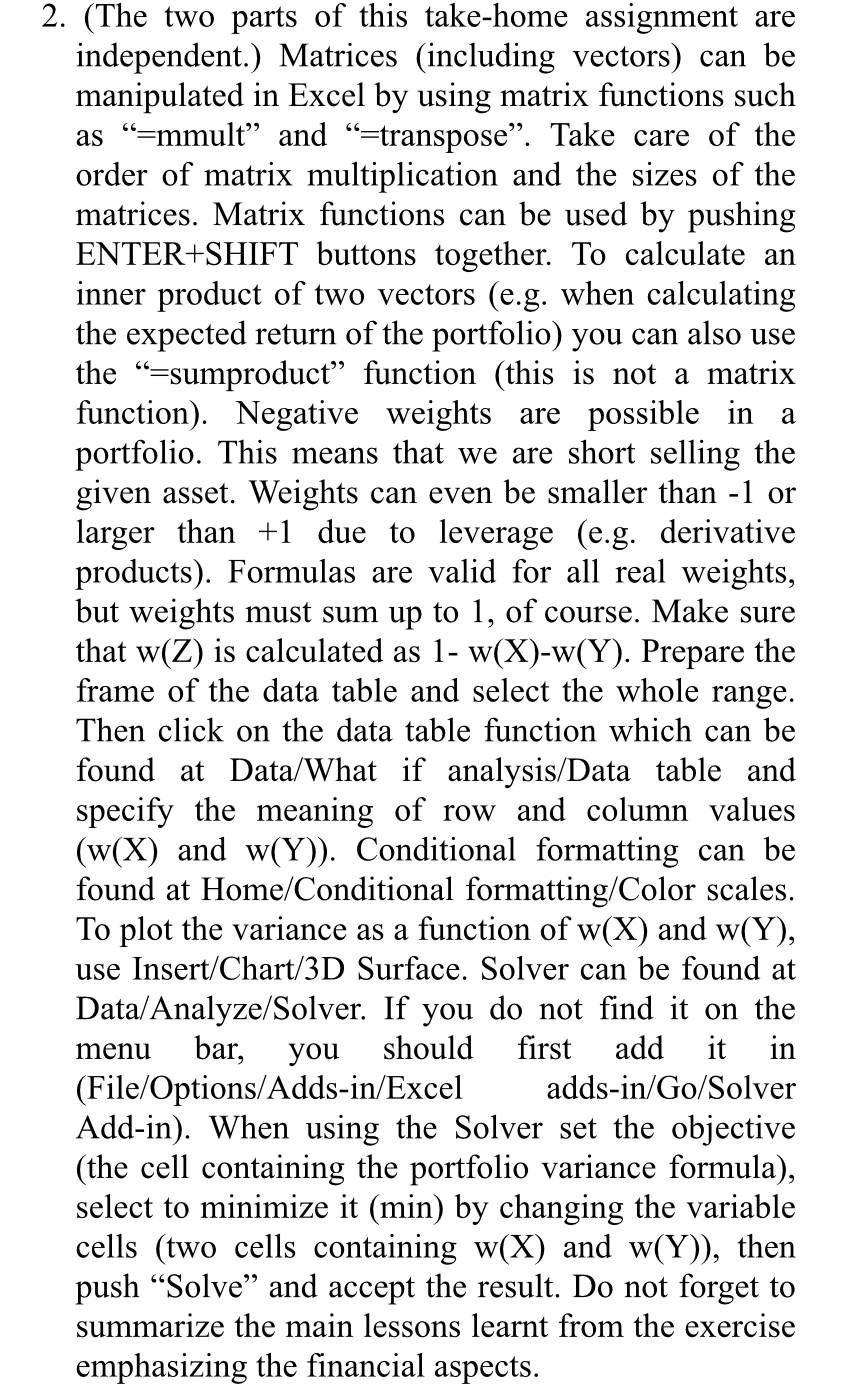 1. Simulate 250 realizations of log returns of two stocks both obeying normal distributions with means zero, standard deviations 0.02 and 0.04 , respectively, if the correlation between the two stocks is 0.8. Depict the realizations on an xy scatter plot. Try different values of correlation and discuss the results (2-3 sentences). 2. The expected yearly effective returns of stocks X,Y, and Z are r=[0.08,0.1,0.12] and the standard deviations are s=[0.15,0.25,0.35]. The correlation matrix between the stock returns is Calculate the covariance matrix between the stocks. Consider a stock portfolio with weights w(X),w(Y), and w(Z) where weights are real numbers summing up to 100%. Calculate the expected return and the variance of the portfolio of equal weights. Prepare a data table that shows the portfolio variance in function of the weights w(X) and w(Y) (both ranging from 200% to +200% in 20% increments). Apply a conditional formatting to the data table in such a way that the lowest variances are colored in green while the highest variances are colored in red. Plot the portfolio variance as a function of the two weights. Determine the minimum variance portfolio with solver. Discuss the results (2-3 sentences). Hints: 1. First, simulate two independent standard normal variables z1 and z2 and repeat it 250 times. Then, calculate the corresponding correlated standard normal variables x1 and x2 as x1=z1 and x2=z10.8+z2(10.82)0.5. Finally, multiply x1 and x2 by the corresponding standard deviations. Try different correlations. What can we see on the figure if the correlation is 1,0.5,0,0.5, and 1 ? Summarize what you see. (The two parts of this take-home assignment are independent.) Matrices (including vectors) can be manipulated in Excel by using matrix functions such as "=mmult" and "=transpose". Take care of the order of matrix multiplication and the sizes of the matrices. Matrix functions can be used by pushing ENTER+SHIFT buttons together. To calculate an inner product of two vectors (e.g. when calculating the expected return of the portfolio) you can also use the "=sumproduct" function (this is not a matrix function). Negative weights are possible in a portfolio. This means that we are short selling the given asset. Weights can even be smaller than -1 or larger than +1 due to leverage (e.g. derivative products). Formulas are valid for all real weights, but weights must sum up to 1 , of course. Make sure that w(Z) is calculated as 1w(X)w(Y). Prepare the frame of the data table and select the whole range. Then click on the data table function which can be found at Data/What if analysis/Data table and specify the meaning of row and column values (w(X) and w(Y) ). Conditional formatting can be found at Home/Conditional formatting/Color scales. To plot the variance as a function of w(X) and w(Y), use Insert/Chart/3D Surface. Solver can be found at Data/Analyze/Solver. If you do not find it on the menu bar, you should first add it in (File/Options/Adds-in/Excel adds-in/Go/Solver Add-in). When using the Solver set the objective (the cell containing the portfolio variance formula), select to minimize it (min) by changing the variable cells (two cells containing w(X) and w(Y) ), then push "Solve" and accept the result. Do not forget to summarize the main lessons learnt from the exercise emphasizing the financial aspects. 1. Simulate 250 realizations of log returns of two stocks both obeying normal distributions with means zero, standard deviations 0.02 and 0.04 , respectively, if the correlation between the two stocks is 0.8. Depict the realizations on an xy scatter plot. Try different values of correlation and discuss the results (2-3 sentences). 2. The expected yearly effective returns of stocks X,Y, and Z are r=[0.08,0.1,0.12] and the standard deviations are s=[0.15,0.25,0.35]. The correlation matrix between the stock returns is Calculate the covariance matrix between the stocks. Consider a stock portfolio with weights w(X),w(Y), and w(Z) where weights are real numbers summing up to 100%. Calculate the expected return and the variance of the portfolio of equal weights. Prepare a data table that shows the portfolio variance in function of the weights w(X) and w(Y) (both ranging from 200% to +200% in 20% increments). Apply a conditional formatting to the data table in such a way that the lowest variances are colored in green while the highest variances are colored in red. Plot the portfolio variance as a function of the two weights. Determine the minimum variance portfolio with solver. Discuss the results (2-3 sentences). Hints: 1. First, simulate two independent standard normal variables z1 and z2 and repeat it 250 times. Then, calculate the corresponding correlated standard normal variables x1 and x2 as x1=z1 and x2=z10.8+z2(10.82)0.5. Finally, multiply x1 and x2 by the corresponding standard deviations. Try different correlations. What can we see on the figure if the correlation is 1,0.5,0,0.5, and 1 ? Summarize what you see. (The two parts of this take-home assignment are independent.) Matrices (including vectors) can be manipulated in Excel by using matrix functions such as "=mmult" and "=transpose". Take care of the order of matrix multiplication and the sizes of the matrices. Matrix functions can be used by pushing ENTER+SHIFT buttons together. To calculate an inner product of two vectors (e.g. when calculating the expected return of the portfolio) you can also use the "=sumproduct" function (this is not a matrix function). Negative weights are possible in a portfolio. This means that we are short selling the given asset. Weights can even be smaller than -1 or larger than +1 due to leverage (e.g. derivative products). Formulas are valid for all real weights, but weights must sum up to 1 , of course. Make sure that w(Z) is calculated as 1w(X)w(Y). Prepare the frame of the data table and select the whole range. Then click on the data table function which can be found at Data/What if analysis/Data table and specify the meaning of row and column values (w(X) and w(Y) ). Conditional formatting can be found at Home/Conditional formatting/Color scales. To plot the variance as a function of w(X) and w(Y), use Insert/Chart/3D Surface. Solver can be found at Data/Analyze/Solver. If you do not find it on the menu bar, you should first add it in (File/Options/Adds-in/Excel adds-in/Go/Solver Add-in). When using the Solver set the objective (the cell containing the portfolio variance formula), select to minimize it (min) by changing the variable cells (two cells containing w(X) and w(Y) ), then push "Solve" and accept the result. Do not forget to summarize the main lessons learnt from the exercise emphasizing the financial aspects
 Step by Step Solution
There are 3 Steps involved in it
Step: 1

Get Instant Access to Expert-Tailored Solutions
See step-by-step solutions with expert insights and AI powered tools for academic success
Step: 2

Step: 3
Ace Your Homework with AI
Get the answers you need in no time with our AI-driven, step-by-step assistance
Get Started
Finance Operations
Authors: Charles Finley
1st Edition
1491292423, 978-1491292426