

Answered step by step
Verified Expert Solution
Question
1 Approved Answer
1. Start with the temperature at 1000 K. In the data table below, record the peak wavelength. Then, increase the temperature by 1000 K
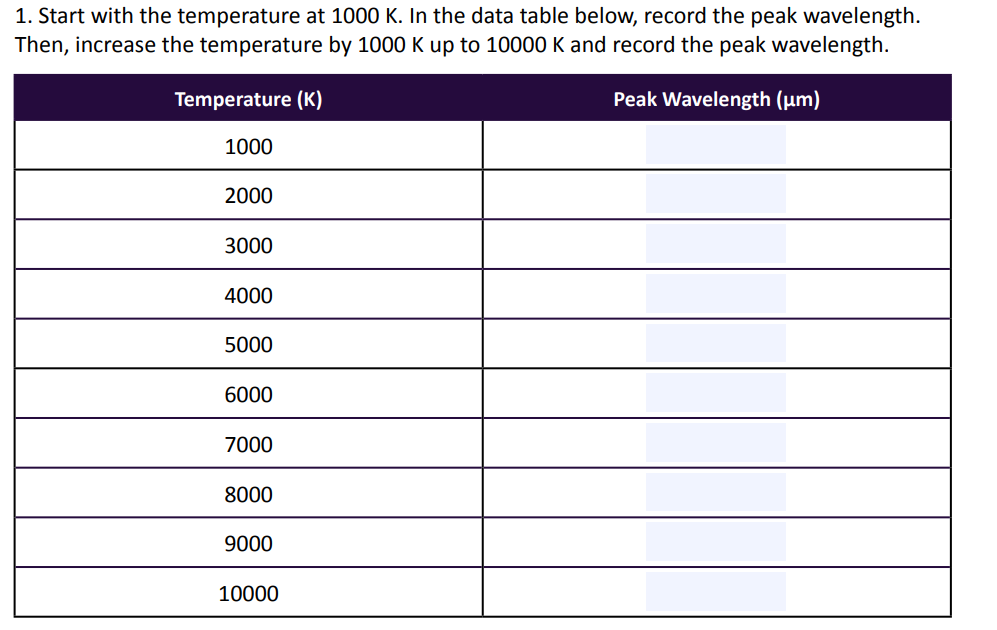
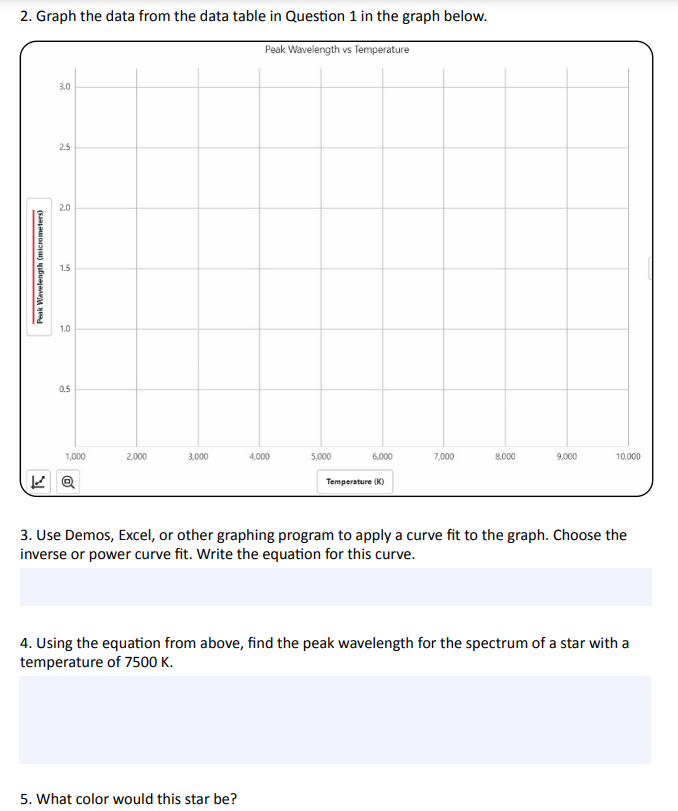
1. Start with the temperature at 1000 K. In the data table below, record the peak wavelength. Then, increase the temperature by 1000 K up to 10000 K and record the peak wavelength. Temperature (K) 1000 2000 3000 4000 5000 6000 7000 8000 9000 10000 Peak Wavelength (m) 2. Graph the data from the data table in Question 1 in the graph below. Peak Wavelength (micrometers) 3.0 2.5 2.0 1.5 1.0 0.5 Peak Wavelength vs Temperature 1,000 2,000 3,000 4,000 5,000 6,000 7,000 8,000 9,000 10,000 Temperature (K) 3. Use Demos, Excel, or other graphing program to apply a curve fit to the graph. Choose the inverse or power curve fit. Write the equation for this curve. 4. Using the equation from above, find the peak wavelength for the spectrum of a star with a temperature of 7500 K. 5. What color would this star be?
Step by Step Solution
There are 3 Steps involved in it
Step: 1

Get Instant Access to Expert-Tailored Solutions
See step-by-step solutions with expert insights and AI powered tools for academic success
Step: 2

Step: 3
Ace Your Homework with AI
Get the answers you need in no time with our AI-driven, step-by-step assistance
Get Started
Thermodynamics An Engineering Approach
Authors: Yunus A. Cengel, Michael A. Boles
8th edition
73398179, 978-0073398174