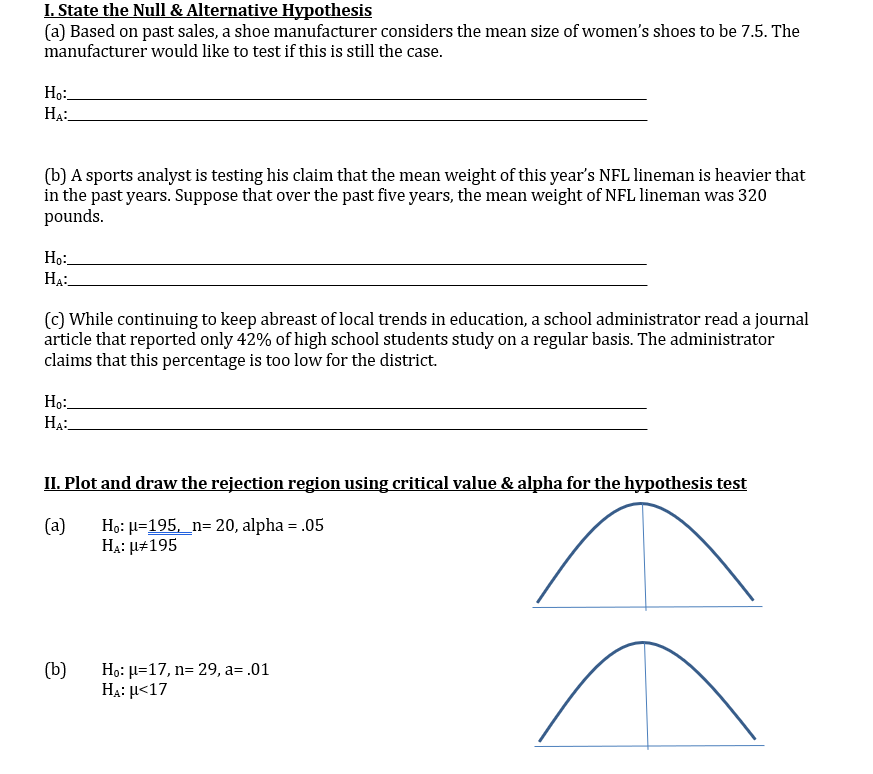
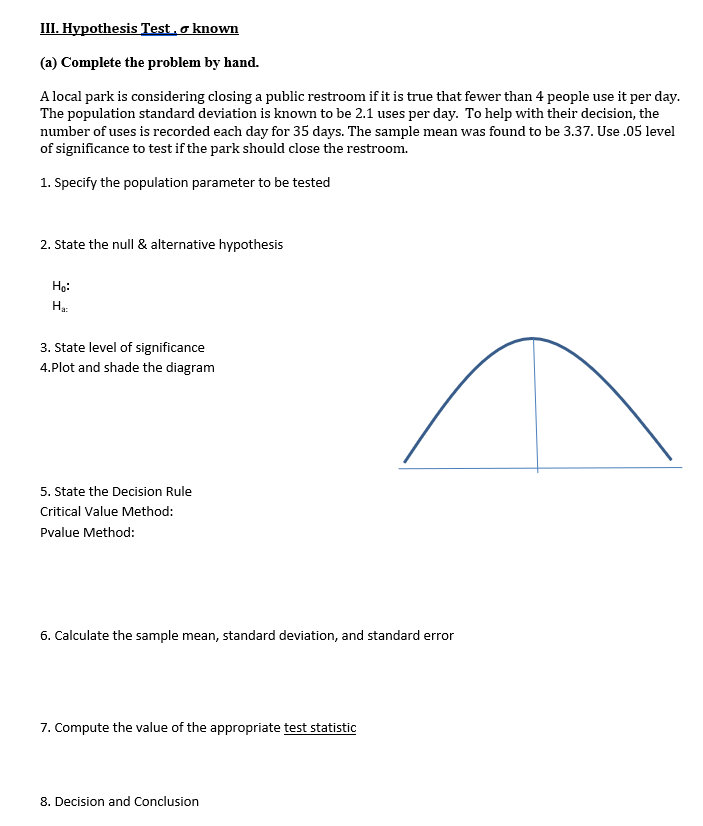
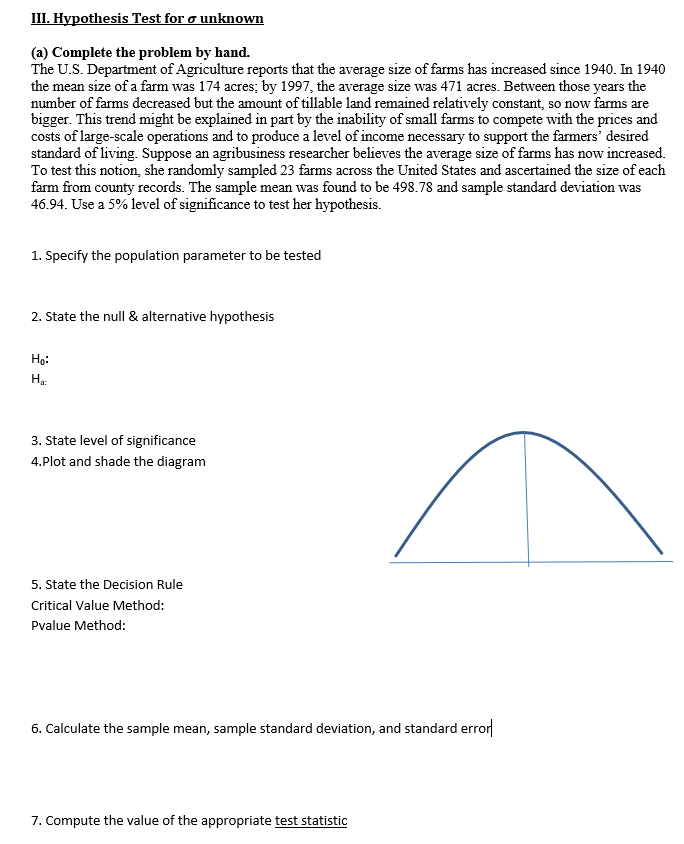
1. State the Null &Alternative Hypothesis (a) Based on past sales, a shoe manufacturer considers the mean size of women's shoes to be 7.5. The manufacturer would like to test if this is still the case. Ha: HA: (b) A sports analyst is testing his claim that the mean weight ofthis year's NFL lineman is heavier that in the past years. Suppose that over the past five years, the mean weight of NFL lineman was 321'] pounds. HI]: HA: (c) While continuing to keep abreast oflocal trends in education, a school administrator read a journal article that reported onlj,r 42 \"/0 of high school students stud}r on a regular basis. The administrator claims that this percentage is too low for the district. Ha: HA: [1. Plot and draw the rejection reg: on using critical value 8; alpha for the hypothesis test (a) Ho: p=195 n= 20, alpha = .05 HA: p195 [b]: He: u=1?', n: 29, a=.{11 HA: p-cl? III. Hypothesis Test , & known (a) Complete the problem by hand. A local park is considering closing a public restroom if it is true that fewer than 4 people use it per day. The population standard deviation is known to be 2.1 uses per day. To help with their decision, the number of uses is recorded each day for 35 days. The sample mean was found to be 3.37. Use .05 level of significance to test if the park should close the restroom. 1. Specify the population parameter to be tested 2. State the null & alternative hypothesis Ho: Ha 3. State level of significance 4.Plot and shade the diagram 5. State the Decision Rule Critical Value Method: Pvalue Method: 6. Calculate the sample mean, standard deviation, and standard error 7. Compute the value of the appropriate test statistic 8. Decision and ConclusionIII. Hypothesis Test for o unknown (a) Complete the problem by hand. The U.S. Department of Agriculture reports that the average size of farms has increased since 1940. In 1940 the mean size of a farm was 174 acres; by 1997, the average size was 471 acres. Between those years the number of farms decreased but the amount of tillable land remained relatively constant, so now farms are bigger. This trend might be explained in part by the inability of small farms to compete with the prices and costs of large-scale operations and to produce a level of income necessary to support the farmers' desired standard of living. Suppose an agribusiness researcher believes the average size of farms has now increased. To test this notion, she randomly sampled 23 farms across the United States and ascertained the size of each farm from county records. The sample mean was found to be 498.78 and sample standard deviation was 46.94. Use a 5% level of significance to test her hypothesis. 1. Specify the population parameter to be tested 2. State the null & alternative hypothesis Ho: Ha: 3. State level of significance 4.Plot and shade the diagram 5. State the Decision Rule Critical Value Method: Pvalue Method: 6. Calculate the sample mean, sample standard deviation, and standard error 7. Compute the value of the appropriate test statistic