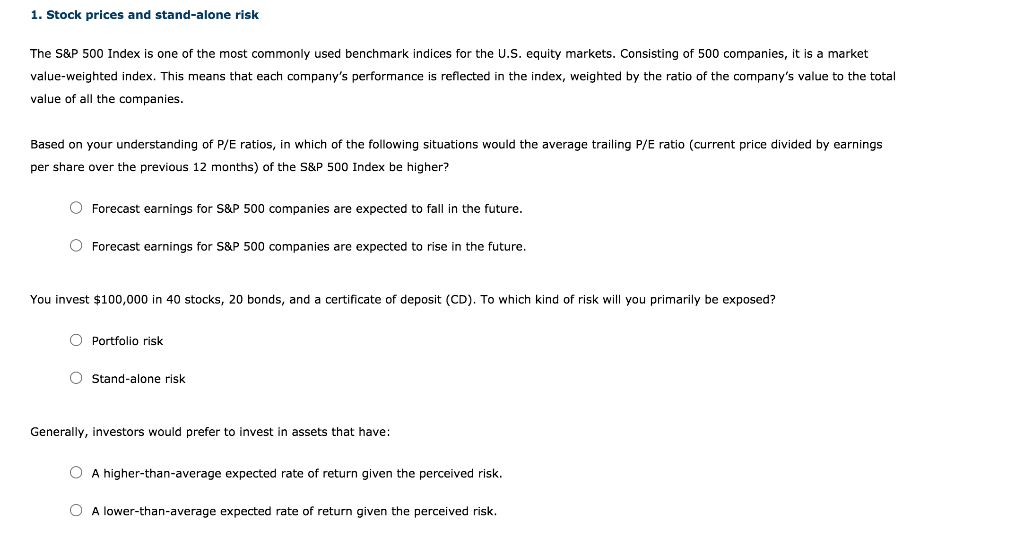
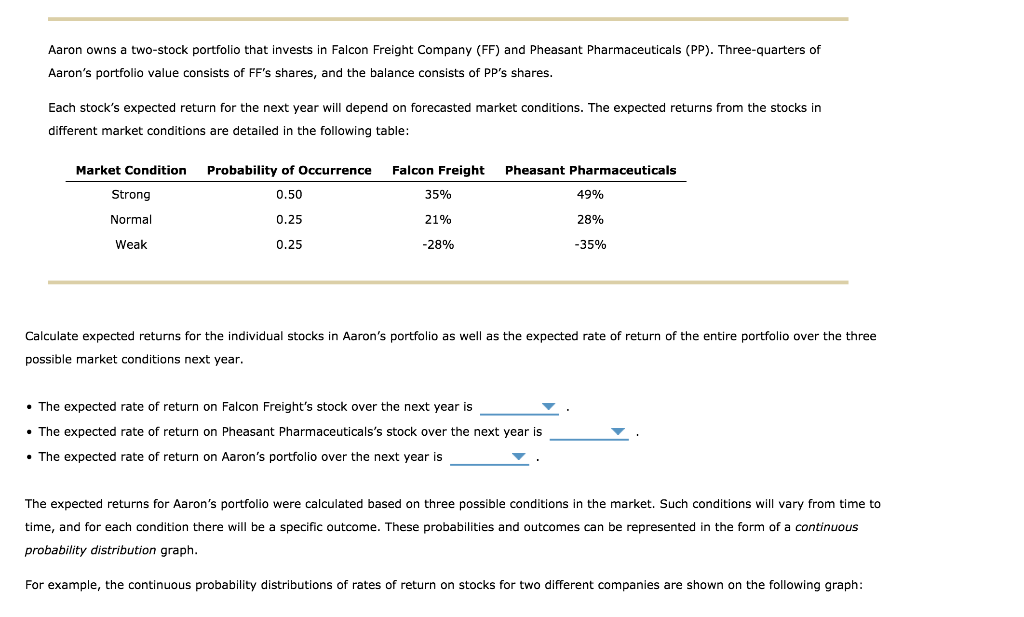
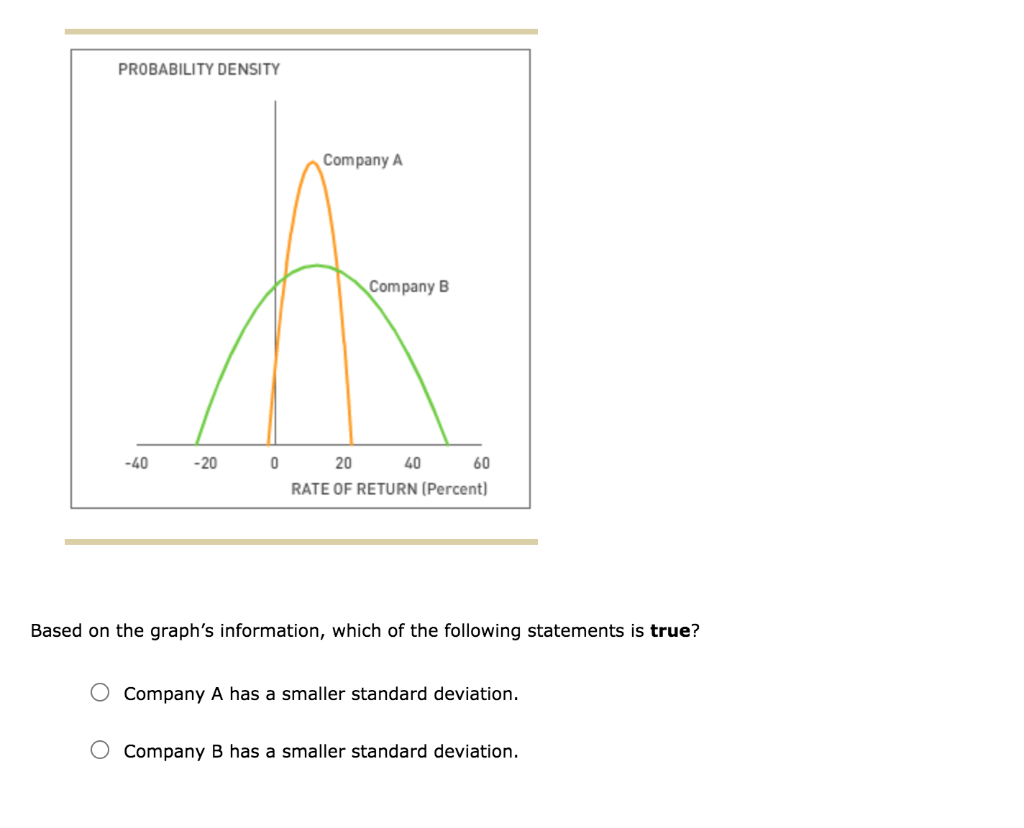
1. Stock prices and stand-alone risk The S&P 500 Index is one of the most commonly used benchmark indices for the U.S. equity markets. Consisting of 500 companies, it is a market value-weighted index. This means that each company's performance is reflected in the index, weighted by the ratio of the company's value to the total value of all the companies. Based on your understanding of P/E ratios, in which of the following situations would the average trailing P/E ratio (current price divided by earnings per share over the previous 12 months) of the S&P 500 Index be higher? O Forecast earnings for S&P 500 companies are expected to fall in the future. O Forecast earnings for S&P 500 companies are expected to rise in the future. You invest $100,000 in 40 stocks, 20 bonds, and a certificate of deposit (CD). To which kind of risk will you primarily be exposed? O Portfolio risk O Stand-alone risk Generally, investors would prefer to invest in assets that have: O A higher-than-average expected rate of return given the perceived risk. O A lower-than-average expected rate of return given the perceived risk. Aaron owns a two-stock portfolio that invests in Falcon Freight Company (FF) and Pheasant Pharmaceuticals (PP). Three-quarters of Aaron's portfolio value consists of FF's shares, and the balance consists of PP's shares. Each stock's expected return for the next year will depend on forecasted market conditions. The expected returns from the stocks in different market conditions are detailed in the following table: Market Condition Probability of Occurrence Falcon Freight Pheasant Pharmaceuticals Strong 0.50 35% 49% Normal 0.25 21% 28% Weak 0.25 -28% -35% Calculate expected returns for the individual stocks in Aaron's portfolio as well as the expected rate of return of the entire portfolio over the three possible market conditions next year. The expected rate of return on Falcon Freight's stock over the next year is The expected rate of return on Pheasant Pharmaceuticals's stock over the next year is The expected rate of return on Aaron's portfolio over the next year is The expected returns for Aaron's portfolio were calculated based on three possible conditions in the market. Such conditions will vary from time to time, and for each condition there will be a specific outcome. These probabilities and outcomes can be represented in the form of a continuous probability distribution graph. For example, the continuous probability distributions of rates of return on stocks for two different companies are shown on the following graph: PROBABILITY DENSITY Company A Company B -20 0 60 RATE OF RETURN (Percent) Based on the graph's information, which of the following statements is true? Company A has a smaller standard deviation. Company B has a smaller standard deviation