

Question: 1. Suppose steel sheets produced by a machine has a thickness that is uniformly distributed with values between 150 to 200 millimetres. Any sheets less
1. Suppose steel sheets produced by a machine has a thickness that is uniformly distributed with values between 150 to 200 millimetres. Any sheets less than 160 millimetre must be scrapped because they are unacceptable to buyers. Let's x be the thickness of the sheets produced by this machine:
a. Calculate and interpret the mean and standard deviation of x
b. Graph probability distribution of x
c. Calculate the fraction of the steel sheets produced by this machine that have to be scrapped
2. Find probability that a standard normal random variable ? falls between -1.33 and 1.33
3. Consider standard normal random variable, z. find the following tail probabilities.
a. P(? >1.64)
b. P(?
c. P(|?| >1.96)
4. Assume that length of time, x, between charges of a cellphone is normally distributed with a mean f 10 hours and a standard deviation of 1.5 hours. Find the probability that a cellphone will last between 8 and 12 hours between charges.
5. Suppose an automobile manufacturer introduces a new model that has an advertised mean in city mileage of 27 mpg. Assume that manufacturer has informed your company that the standard of this advertised mileage is 3 mpg and data is normally distributed. Your company has tasked you to calculate if the company buys one of these models:
a. What is the probability that the average mileage is less than 20 mpg?
6. Use a normal probability table to find
a. P(z>z0) = 0.1
b. P(-z0 7. Suppose a paint manufacturer has a daily production, x, that is normally distributed with a mean of 100,000 gallons and a standard deviation of 10,000 gallons. Management wants to create an incentive bonus for the production crew when daily production exceeds the 90th percentile of the distribution. At what level of production should management pay the incentive bonus? 8. Suppose a manufacturer of calculators chooses 200 stamped circuits from the day's production and determines x, the number of defective circuits in the sample. Suppose that up to 6% rate if defectives is considered acceptable for the process. a. Find the mean and standard deviation of x, assuming the defective rate is 6%. b. Use the normal approximation to determine the probability that 20 or more defectives are observed in the sample of 200 circuits 9. Suppose the length of time (in hours) between emergency arrivals and at a certain hospital has an exponential distribution with ? = 2. a. What is the probability that 5 hours pass without emergency arrivals? 10. Determine the area under the standard normal curve that lies to the left of 1.23 11. Determine the area under the normal curve that lies to the right of 0.76 12. Determine the area under the normal curve that lies between (-0.68) and 1.82 13. Determine the score having an area of 0.04 to its left under the standard normal curve 14. Use a normal probability table to find a. ? 0.025 b. ? 0.05 15. Find two? scores that divide the area under the standard normal curve into a middle 0.95 area and two outside 0.025 areas. 16) The U.S. Department of Agriculture publishes data on U.S. chicken consumption in Food Consumption, Prices, and Expenditures. Last year's chicken consumption in pounds, for 17 randomly selected people are displayed in the table below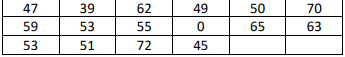
Step by Step Solution
There are 3 Steps involved in it

Get step-by-step solutions from verified subject matter experts