Answered step by step
Verified Expert Solution
Link Copied!

Question

1 Approved Answer

1. Suppose that the following graph represents the optimal consumption bundle of a typical con- sumer, with an income of 80, facing prices PX =

image text in transcribed
1. Suppose that the following graph represents the optimal consumption bundle of a typical con- sumer, with an income of 80, facing prices PX = l and Er = 1 and with utility U=XY. E} (a) Now, let income remain xed let prices rise so that Px = 2.Py : 4. Illustrate the new budget line and draw a sample indifference curve to showr the new equilibrium bundle. E {b} Let income be indexed to the cost of living so that budget line shifts out just enough that the old bundle [at the original prices! above] is just acndable. In other words. let income increase to 240. is the old bundle still the optimal choice at the new income level and new prices? Has utility increased above that of the original consumption bundle? Explain using a diagram. E {13) Suppose that prices are now P}; = 2,.Py = 2, and income has increased to 160 {so that both income and prices have exactly doubled over the original levels). Is the old bundle optimal now? Has utility increased above that of the original consumption bundle

Step by Step Solution

There are 3 Steps involved in it

Step: 1

blur-text-image

Get Instant Access to Expert-Tailored Solutions

See step-by-step solutions with expert insights and AI powered tools for academic success

Step: 2

blur-text-image

Step: 3

blur-text-image

Ace Your Homework with AI

Get the answers you need in no time with our AI-driven, step-by-step assistance

Get Started

Recommended Textbook for

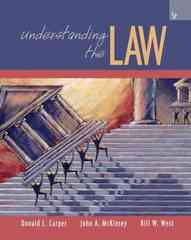
Understanding The Law

Authors: Donald L Carper, John A McKinsey, Bill W West

5th Edition

0324375123, 9780324375121

More Books

Students also viewed these Economics questions

Question

Always show respect for the other person or persons.

Answered: 1 week ago

Question

Self-awareness is linked to the businesss results.

Answered: 1 week ago