Answered step by step
Verified Expert Solution
Link Copied!

Question

1 Approved Answer

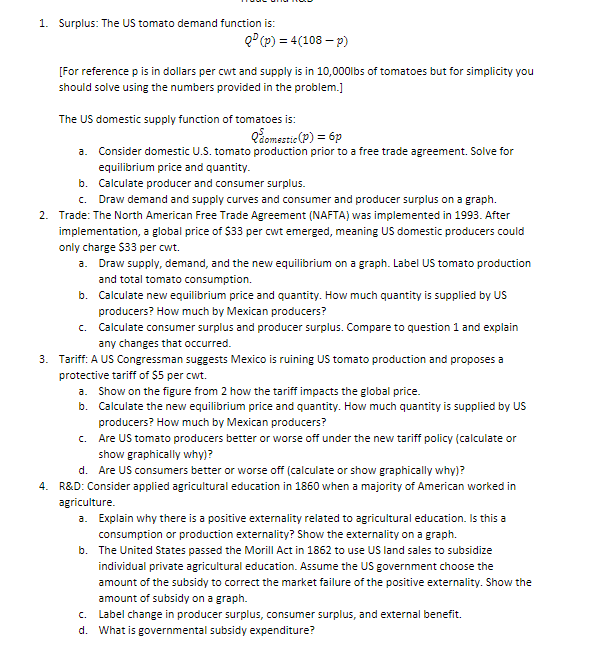
1. Surplus: The US tomato demand function is: Q (p) = 4(108 - p) [ For reference p is in dollars per cwt and supply

image text in transcribed
1. Surplus: The US tomato demand function is: Q" (p) = 4(108 - p) [ For reference p is in dollars per cwt and supply is in 10,000lbs of tomatoes but for simplicity you should solve using the numbers provided in the problem.] The US domestic supply function of tomatoes is: Qdomestic (P) = 6p a. Consider domestic U.S. tomato production prior to a free trade agreement. Solve for equilibrium price and quantity. b. Calculate producer and consumer surplus. c. Draw demand and supply curves and consumer and producer surplus on a graph. 2. Trade: The North American Free Trade Agreement (NAFTA) was implemented in 1993. After implementation, a global price of $35 per cwt emerged, meaning US domestic producers could only charge $33 per cut. a. Draw supply, demand, and the new equilibrium on a graph. Label US tomato production and total tomato consumption. b. Calculate new equilibrium price and quantity. How much quantity is supplied by US producers? How much by Mexican producers? c. Calculate consumer surplus and producer surplus. Compare to question 1 and explain any changes that occurred. 3. Tariff: A US Congressman suggests Mexico is ruining US tomato production and proposes a protective tariff of $5 per cwt. a. Show on the figure from 2 how the tariff impacts the global price. b. Calculate the new equilibrium price and quantity. How much quantity is supplied by US producers? How much by Mexican producers? C. Are US tomato producers better or worse off under the new tariff policy (calculate or show graphically whyl? d. Are US consumers better or worse off (calculate or show graphically why)? R&D: Consider applied agricultural education in 1860 when a majority of American worked in agriculture Explain why there is a positive externality related to agricultural education. Is this a consumption or production externality? Show the externality on a graph. The United States passed the Morill Act in 1862 to use US land sales to subsidize individual private agricultural education. Assume the US government choose the amount of the subsidy to correct the market failure of the positive externality. Show the amount of subsidy on a graph. c. Label change in producer surplus, consumer surplus, and external benefit. d. What is governmental subsidy expenditure

Step by Step Solution

There are 3 Steps involved in it

Step: 1

blur-text-image

Get Instant Access to Expert-Tailored Solutions

See step-by-step solutions with expert insights and AI powered tools for academic success

Step: 2

blur-text-image

Step: 3

blur-text-image

Ace Your Homework with AI

Get the answers you need in no time with our AI-driven, step-by-step assistance

Get Started

Recommended Textbook for

Principles Of Macroeconomics

Authors: N Gregory Mankiw

7th Edition

1285165918, 9781285165912

More Books

Students also viewed these Economics questions

Question

The fear of making a fool of oneself

Answered: 1 week ago

Question

Annoyance about a statement that has been made by somebody

Answered: 1 week ago