

Answered step by step
Verified Expert Solution
Question
1 Approved Answer
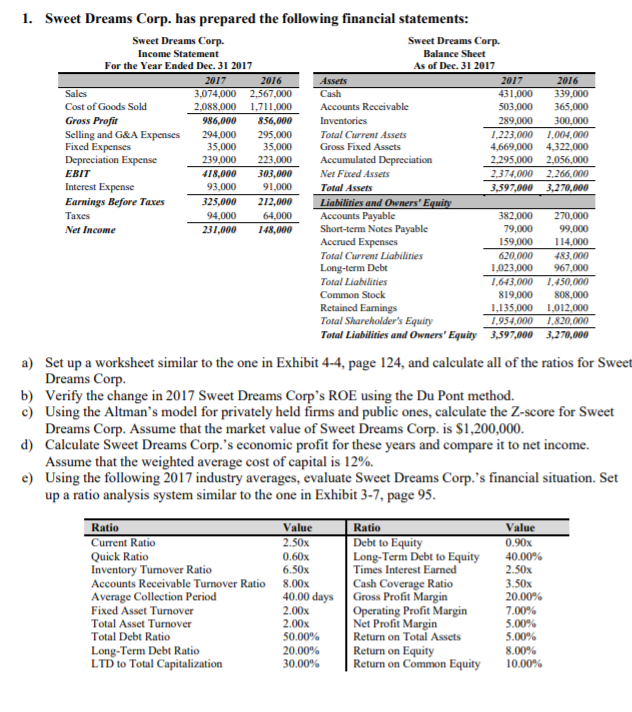
1. Sweet Dreams Corp. has prepared the following financial statements: Sweet Dreams Corp. Income Statement For the Year Ended Dec. 31 2017 Sweet Dreams Corp.
Step by Step Solution
There are 3 Steps involved in it
Step: 1

Get Instant Access to Expert-Tailored Solutions
See step-by-step solutions with expert insights and AI powered tools for academic success
Step: 2

Step: 3
Ace Your Homework with AI
Get the answers you need in no time with our AI-driven, step-by-step assistance
Get Started
Fundamental Financial Accounting Concepts Paperback By Edmonds Thomas P O
Authors: Thomas P. Edmonds, Christopher Edmonds, Mark A. Edmonds, Jennifer Edmonds, Philip R. Olds
11th Edition
9781264266234, 1264266235