

Answered step by step
Verified Expert Solution
Question
1 Approved Answer
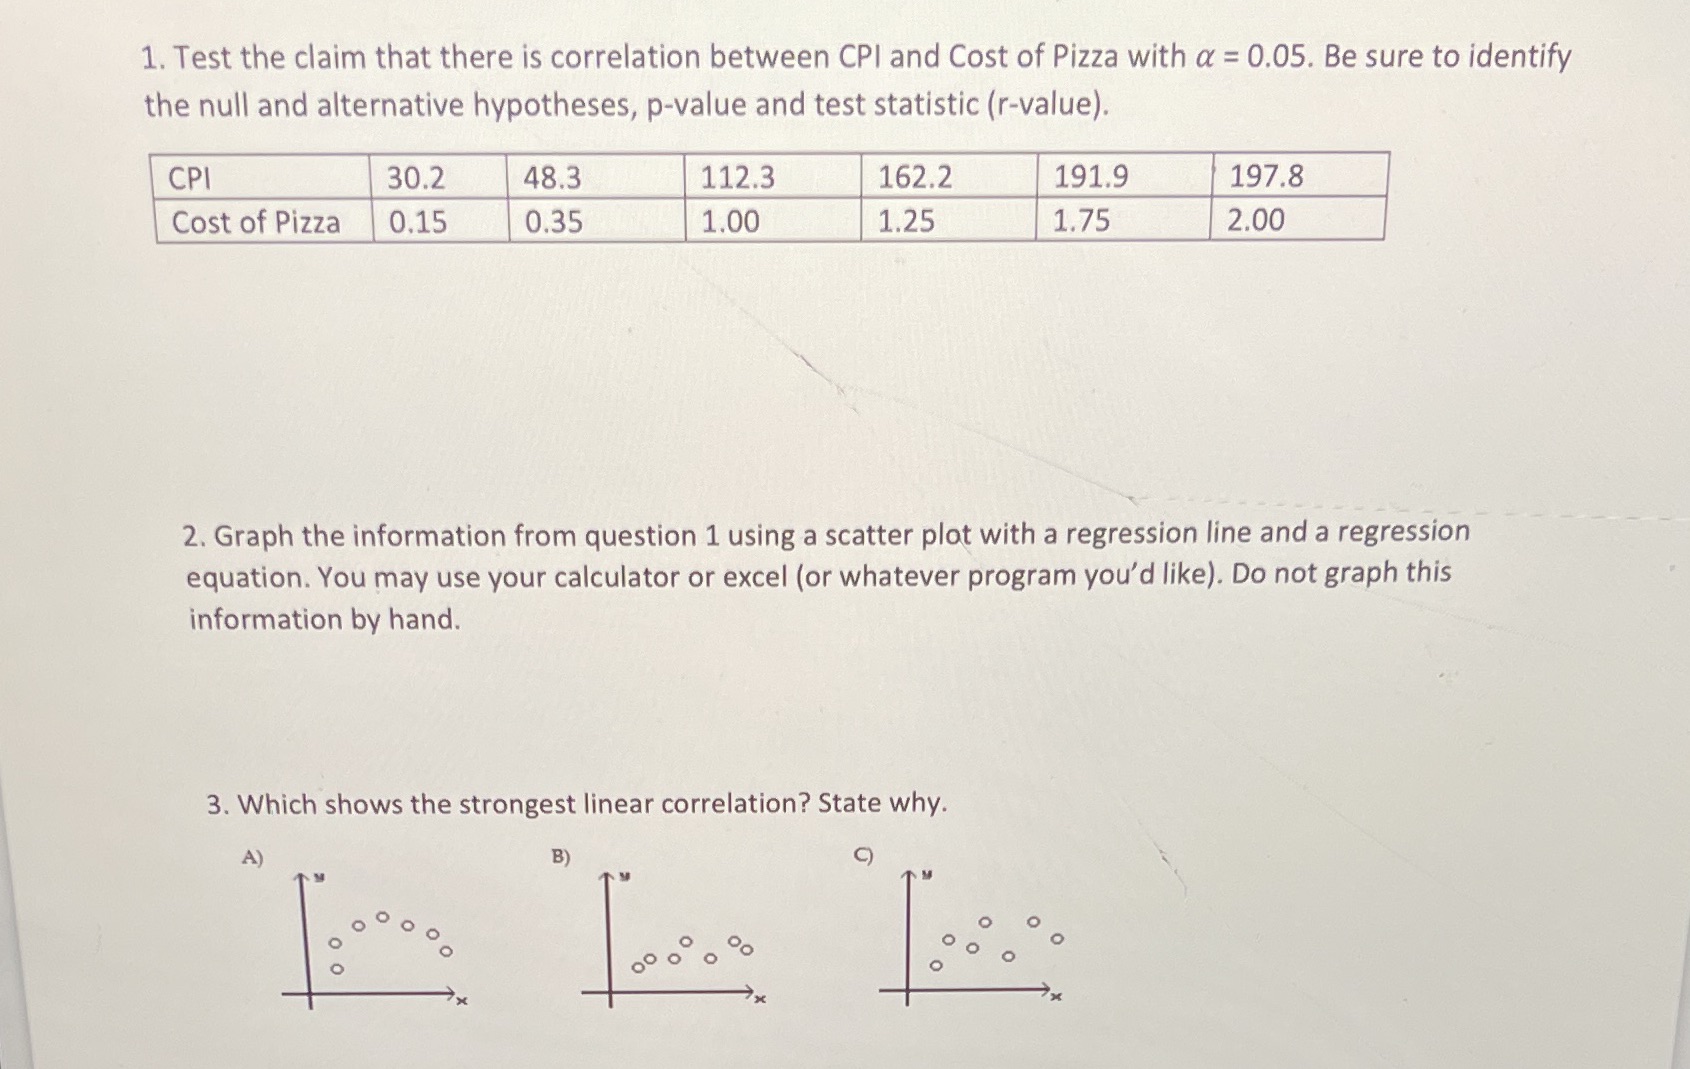
1. Test the claim that there is correlation between CPI and Cost of Pizza with a = 0.05. Be sure to identify the null and
Step by Step Solution
There are 3 Steps involved in it
Step: 1

Get Instant Access to Expert-Tailored Solutions
See step-by-step solutions with expert insights and AI powered tools for academic success
Step: 2

Step: 3
Ace Your Homework with AI
Get the answers you need in no time with our AI-driven, step-by-step assistance
Get Started
Basic College Mathematics
Authors: Elayn El Martin Gay
5th Edition
0321983173, 9780321983176